
We are excited to announce that Google Cloud Managed Service for Prometheus is now generally available! Now you can get all the benefits of open source-compatible monitoring with the ease of use of Google-scale managed services.
The rapid adoption of managed platforms and services across the cloud computing industry has shown that fewer and fewer organizations want to invest developer time into managing infrastructure. Google Cloud was recently recognized as a Leader in The Forrester Wave™: Public Cloud Container Platforms, Q1 2022 and in the report the authors note: “Large firms are seeking enterprise container platforms that accelerate and simplify the development and operations of cloud-native apps with resiliency, manageability, and observability via full-stack cloud-native capabilities.”
From our partners:
Getting a better picture of the four golden signals of monitoring, as laid out in Google’s SRE book, means you have to capture metrics. In both self-managed Kubernetes and Google Kubernetes Engine (GKE) environments, the de-facto standard monitoring technology is Prometheus, an open source metrics collection and alerting tool. While Prometheus works great out-of-the-box for smaller deployments, running Prometheus at scale creates some uniquely difficult challenges.
Much like you might use GKE because you prefer to not manage your own Kubernetes infrastructure, Managed Service for Prometheus is here for those who prefer to not manage their own Prometheus infrastructure. Focus your developers’ efforts on building features for your customers, as opposed to focusing efforts on operations toil that merely keeps the lights on.
Since adopting the service, we’ve been able to really streamline our Prometheus management, and we’ve highly enjoyed simplifying our operations by bringing together more data sources into a single pane of glass,” says Jonathan Campos, CTO and VP of Engineering at Alto. “And since we don’t have to worry about managing historical data, we’ve been able to reduce our cluster storage from 1TB down to 50GB while extending our Prometheus data retention period from 7 days to 2 years.
Benefits of using Managed Service for Prometheus
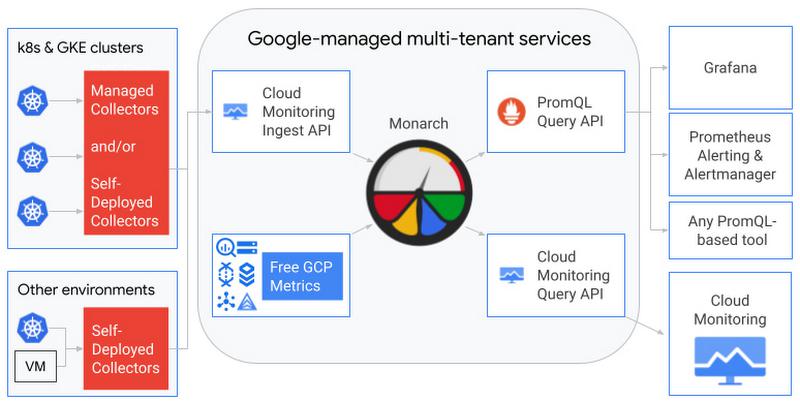
Two-year retention of all metrics, included in the price: Manually sharding long-term storage is a major pain point of running your own Prometheus-compatible aggregator. Thanks to the global scale and scalability of Monarch, the system that powers not just Cloud Monitoring but all monitoring at Google, long-term storage of Managed Service for Prometheus metrics is easy for us. That benefit gets passed along to you as a two-year retention policy, for all metrics, at no additional charge.
Cost-effective monitoring: Switching from open source to a managed service always brings the fear of increased costs, but the pricing model for this service is straightforward and predictable. Charging on a per-sample basis means you pay only while your containers are alive and sending metrics data, taking the worry out of using features like Horizontal Pod Autoscaling that frequently scale containers up and down. Managed Service for Prometheus also provides other cost control and cost reducing measures such as a reduced charge for sparse histograms, a fee structure that charges less for longer sampling periods, and the ability to only send locally pre-aggregated data.
Easy cost identification and attribution: Within Cloud Monitoring, you can easily separate out your Prometheus ingestion volume by metric name and namespace. This allows you to identify which metrics contribute the most to your bill, determine what team’s namespace is responsible for sending those metrics, and take action to reduce your costs.
No changes needed to existing querying or alerting workflows: You can choose to reuse your existing Prometheus collection deployment or switch to our managed collection. In either case you can keep using the same Grafana dashboards and alert configs you’re using today. PromQL compatibility for dashboarding and alerting means that your existing incident creation and investigation workflows will continue to work as before.
Viewing Prometheus metrics and Google Cloud system metrics together: Many organizations try, but struggle to simplify their operations by building a “single pane of glass” for all their metric sources. Because our service is built on the same technology and backend as Cloud Monitoring, your Prometheus metrics can be used with the dashboarding, alerting, and SLO monitoring available within Cloud Monitoring. Chart your Prometheus metrics right alongside your GKE metrics, your load balancer metrics, and more.

Read more from customers who have used Managed Service for Prometheus on our website.
What’s coming up next
General availability is just the beginning! We have many more great Managed Service for Prometheus features on our roadmap, including:
- PromQL querying of free GCP system metrics available in Cloud Monitoring, including GKE, Anthos, and Istio metrics, so you can chart these metrics right alongside your Prometheus metrics in Grafana
- Recommended default collection configs for commonly-used exporters, such as kube-state-metrics and node-exporter
- Optimized network performance for on-prem clusters
- Debugging tools, such as a targets discovery and health page
- And more!
How to get started
Setting up Managed Service for Prometheus is straightforward.
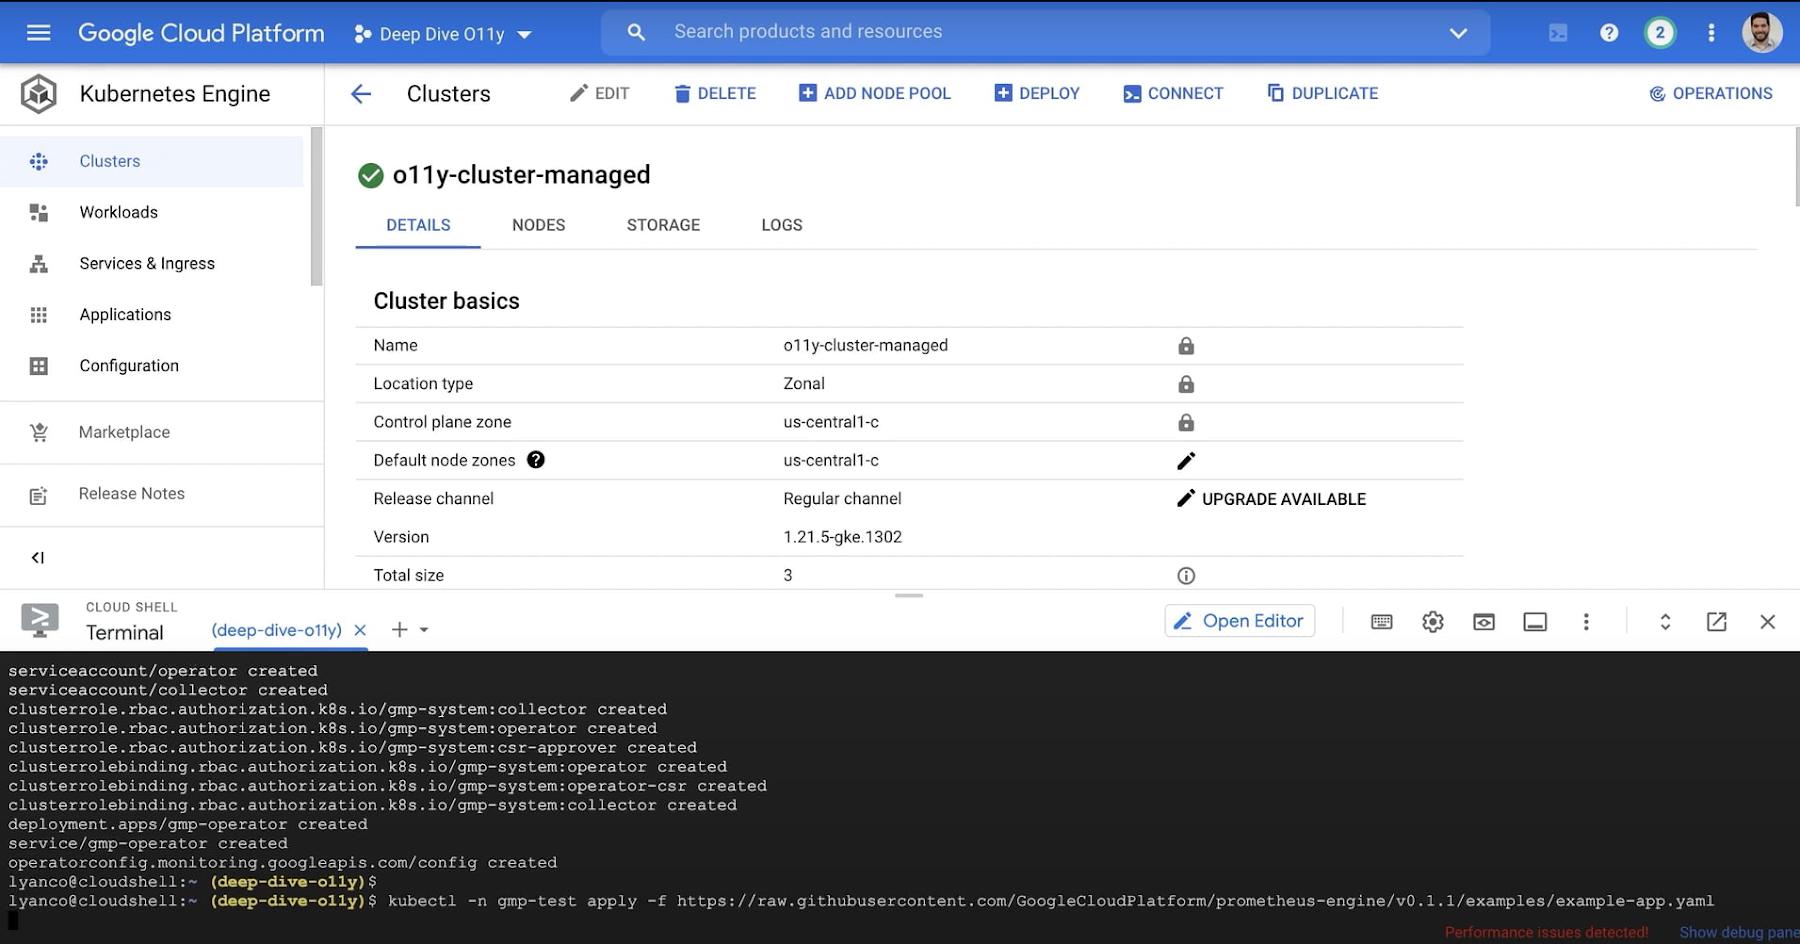
- For those starting from scratch or for those who want a more fully-managed experience, you can deploy managed collectors in any Kubernetes cluster by using the GKE UI in Cloud Console, the
gcloudCLI, orkubectl. - For those with existing Prometheus deployments, you can keep using your existing configuration by just swapping out your Prometheus binary with the Managed Service for Prometheus binary.
See Managed Service for Prometheus documentation to get started. You can also check out this video which walks you through a few different ways to set up the service:

Lastly, if you have questions, feature requests, or just want to read topics from other customers who are using Google Cloud Managed Service for Prometheus and Google Cloud’s operations suite, visit our Google Cloud Community site.
By: Lee Yanco (Product Manager)
Source: Google Cloud Blog
For enquiries, product placements, sponsorships, and collaborations, connect with us at [email protected]. We'd love to hear from you!
Our humans need coffee too! Your support is highly appreciated, thank you!