An essential aspect of operating any application is the ability to observe the health and performance of that application and of the underlying infrastructure to quickly resolve issues as they arise. Google Kubernetes Engine (GKE) already provides audit logs, operational logs, and metrics along with out-of-the-box dashboards and automatic error reporting to facilitate running reliable applications at scale. Using these logs and metrics, Cloud Operations provides the alerts, monitoring dashboards and a Logs Explorer to quickly detect, troubleshoot and resolve issues.
Introducing Kubernetes control plane metrics and why they matter
In addition to these existing sources of telemetry data, we are excited to announce that we are now exposing Kubernetes control plane metrics, which are now Generally Available. With GKE, Google fully manages the Kubernetes control plane; however, when troubleshooting issues it can be helpful to have access to certain metrics emitted by the Kubernetes control plane.
From our partners:
As part of our vision to make Kubernetes easier to use and easier to operate, these control plane metrics are directly integrated with Cloud Monitoring, so you don’t need to manage any metric collection or scrape config.
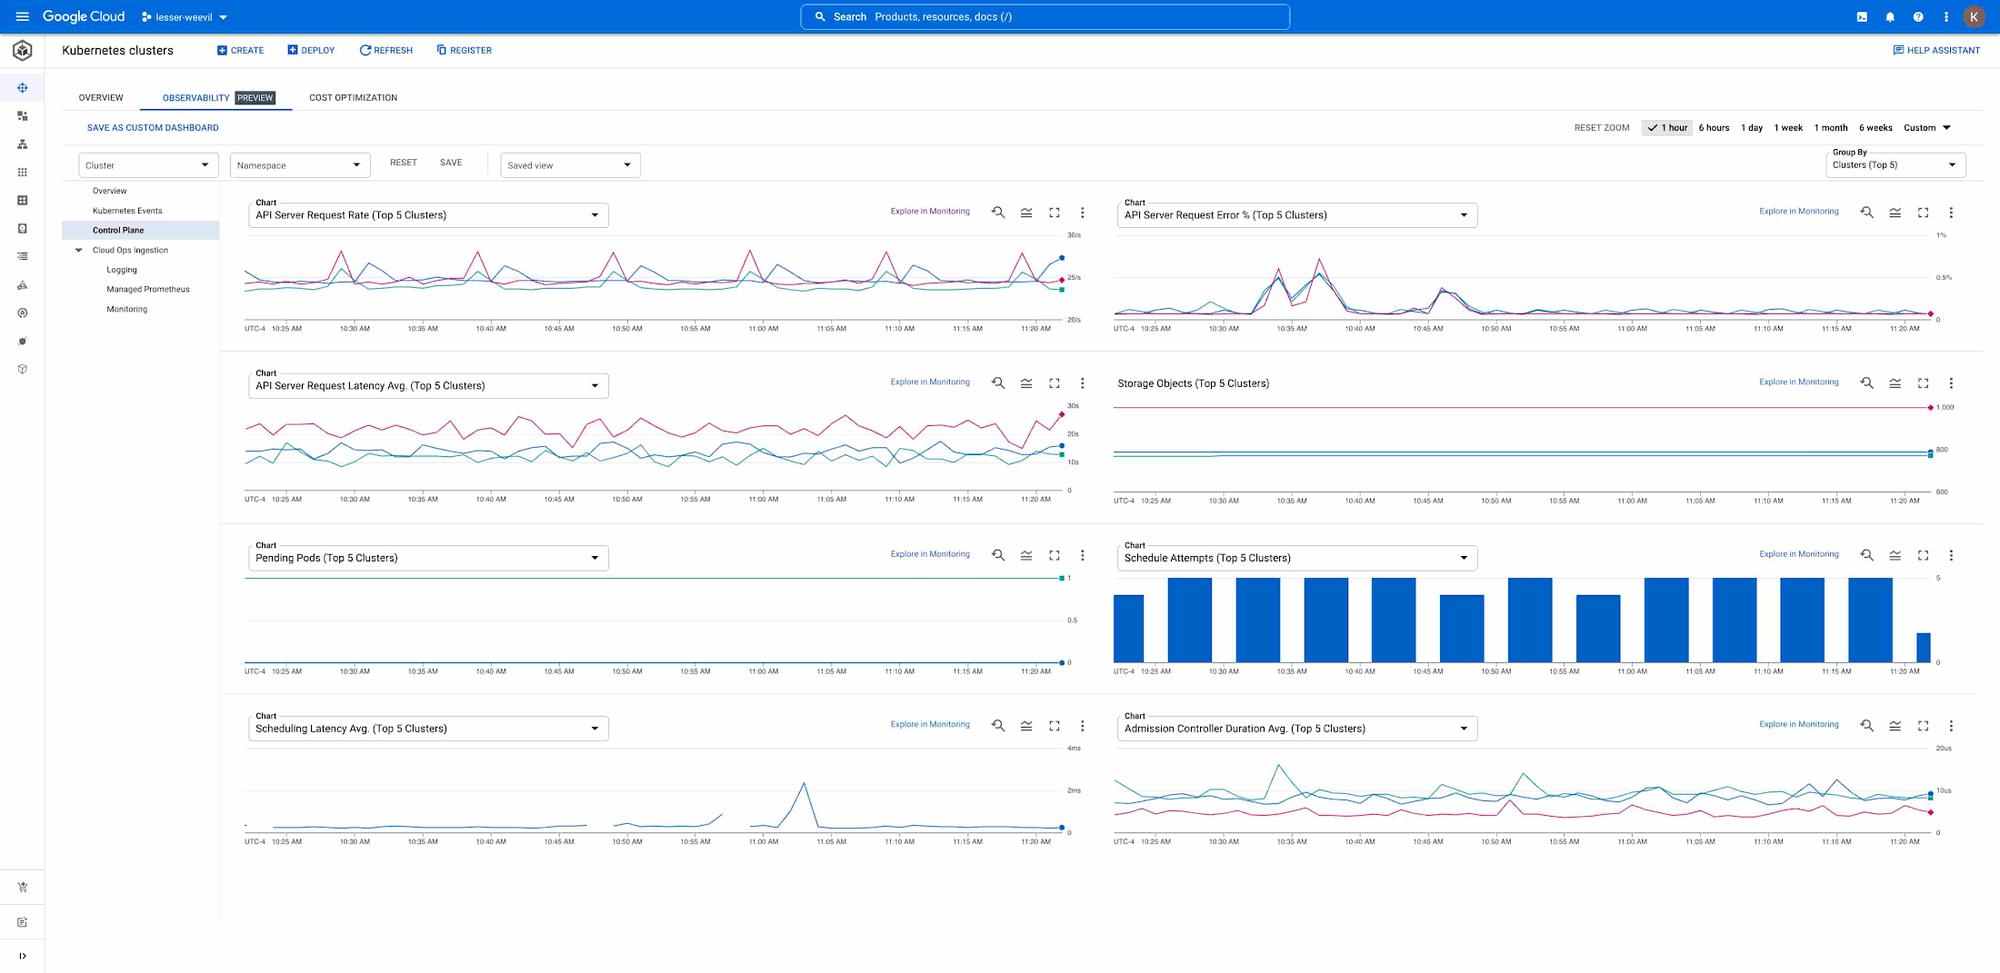
For example, to understand the health of the API server, you can use metrics like apiserver_request_total and apiserver_request_duration_seconds to track the load that the API server is experiencing, the fraction of API server requests that return errors, and the response latency for requests received by the API server. Also, apiserver_storage_objects can be very useful to monitor the saturation of the API server, especially if you’re using custom controllers. Breakdown this metric by the resource label to find out which Kubernetes custom resource or controller is problematic.
When a pod is created it is initially placed in a “pending” state, indicating it hasn’t yet been scheduled on a node. In a healthy cluster, pending pods are relatively quickly scheduled on a node, providing the workload the resources it needs to run. However, a sustained increase in the number of pending pods may indicate a problem scheduling those pods, which may be caused by insufficient resources or inappropriate configuration. Metrics like scheduler_pending_pods, scheduler_schedule_attempts_total, scheduler_preemption_attempts_total, scheduler_preemption_victims , and scheduler_scheduling_attempt_duration_seconds can alert you to potential scheduling issues, so you can act quickly to ensure sufficient resources are available for your pods. Using these metrics in combination will help you better understand the health of your cluster. For instance, if scheduler_preemption_attempts_total goes up, it means that there are higher priority pods available to be scheduled and the Scheduler is preempting some running pods. However, if the value of scheduler_pending_pods is also increasing, this may indicate that you don’t have enough resources to allocate the higher priority pods.
If the Kubernetes scheduler is still unable to find a suitable node for a pod, then the pod will eventually be marked as unschedulable. Kubernetes control plane metrics provide you visibility into pod scheduling errors and unschedulable pods. A spike in either means that the Kubernetes scheduler isn’t able to find an appropriate node on which to run many of your pods, which may ultimately impair the performance of your application. In many cases, a high rate of unschedulable pods will not resolve itself until you take some action to address the underlying cause. A good first place to start troubleshooting the issue is to look for recent FailedScheduling events. (If you have GKE system logs enabled, then all Kubernetes events are available in Cloud Logging.) These FailedScheduling events include a message (for instance, “0/6 nodes are available: 6 Insufficient cpu.”) that very helpfully describes exactly why the pod wasn’t able to be scheduled on any nodes, giving you guidance on how to address the problem.
A final example: If you see scheduling jobs is very slow, then one possible cause is that a third-party webhooks might be introducing significant latency, causing the API server to take a long time to schedule a job. Kubernetes control plane metrics such as apiserver_admission_webhook_admission_duration_seconds can expose the admission webhook latency, helping you identify the root cause of slow job scheduling and mitigate the issue.
Displayed in context
Not only are we making these additional Kubernetes control plane metrics available, we’re also excited to announce that all of these metrics are displayed in the Kubernetes Engine section of the Cloud Console, making it easy to identify and investigate issues in-context as you’re managing your GKE clusters.
To view these control plane metrics, go to the Kubernetes clusters section of the Cloud Console, select the “Observability” tab, and select “Control plane”:
Since all Kubernetes control plane metrics are ingested into Cloud Monitoring, you can create alerting policies in Cloud Alerting so you’re notified as soon as something needs your attention.
PromQL compatible
When you enable Kubernetes control plane metrics for your GKE clusters, all metrics are collected using Google Cloud Managed Service for Prometheus. This means the metrics are sent to Cloud Monitoring in the same GCP project as your Kubernetes cluster and can be queried using PromQL via the Cloud Monitoring API and Metrics explorer.
For example, you can monitor any spikes in the 99th percentile API server response latency using this PromQL query:
sum by (instance, verb) (histogram_quantile(0.99, rate(apiserver_request_duration_seconds_bucket{cluster="cluster-name"}[5m])))
Third-party support
If you monitor your GKE cluster using popular third party observability tools, any third party observability tool can ingest these Kubernetes control plane metrics using the Cloud Monitoring API.
For example, if you’re a Datadog customer and you’ve enabled Kubernetes control plane metrics for your GKE cluster, then Datadog provides enhanced visualizations that include Kubernetes control plane metrics from the API server, scheduler, and controller manager.
Pricing
All Kubernetes control plane metrics are charged at the standard price for metrics ingested from Google Cloud Managed Service for Prometheus.
Get started
GKE clusters running control plane version 1.23.6 or later can now access metrics from the Kubernetes API server, Scheduler, and Controller Manager. Kubernetes control plane metrics are not available for GKE Autopilot clusters.
The following gcloud command will update a cluster to enable the collection of metrics from the API server, scheduler, and controller manager:
gcloud container clusters update [CLUSTER_ID] \--zone=[ZONE] \--project=[PROJECT_ID] \--monitoring=SYSTEM,API_SERVER,SCHEDULER,CONTROLLER_MANAGER
Kubernetes control plane metrics can also be configured using Terraform.
Learn more about configuring the collection of control plane metrics.
By: Nathan Beach (Group Product Manager, Google Kubernetes Engine)
Source: Google Cloud Blog
For enquiries, product placements, sponsorships, and collaborations, connect with us at [email protected]. We'd love to hear from you!
Our humans need coffee too! Your support is highly appreciated, thank you!