
This article is part-II of the series on ‘PyTorch/XLA:Performance Debugging on TPU-VM’. In the previous article we introduced the basic metrics of performance analysis. We used the client side debugging with the PyTorch/XLA profiler to identify how the .equal() operator used inside the Multihead Attention module implementation caused frequent recompilation of the graph causing the training to run slower. We concluded the article with pointers to a potential corrective action and left the post correction performance analysis as an exercise to the reader. In this article we will recap the potential corrective action, analyze the performance with the fix and develop further insights into the performance.
Solving .equal() slowdown
Recall that the choice of torch.equal for MHA (MultiHead Attention) serves to optimize resulting GPU kernels. A potential solution to allow this optimization without creating a bottleneck for TPUs is to qualify torch.equal calls with some (non-trainable configuration) parameter. For instance, an example of this approach is here. In PyTorch 1.9 release, an alternate and simplified implementation was introduced to fix the issue by moving to tensor comparison (is op). We will upgrade to PyTorch 1.9 or later version and then review the training throughput.
From our partners:
Upgrade the environment to PyTorch 1.9
To apply this fix and investigate further we upgrade to PyTorch 1.9 (used for the remainder of this case study).
sudo bash /var/scripts/docker-login.shsudo docker rm libtpu || truesudo docker create --name libtpu gcr.io/cloud-tpu-v2-images/libtpu:pytorch-1.9 "/bin/bash"sudo docker cp libtpu:libtpu.so /libsudo pip3 uninstall --yes torch torch_xla torchvisionsudo pip3 install torch==1.9.0sudo pip3 install torchvision==0.10.0sudo pip3 install https://storage.googleapis.com/tpu-pytorch/wheels/tpuvm/torch_xla-1.9-cp38-cp38-linux_x86_64.whl
Experiment-1: Re-run the training with .equal fix in PyTorch 1.9
With the PyTorch 1.9 environment, the issue with .equal operator in MHA has been resolved. Now let’s re-execute the training to investigate further:
export PT_XLA_DEBUG=1export USE_TORCH=ONpython3 mmf_cli/run.py \config=./projects/unit/configs/all_8_datasets/shared_dec_without_task_embedding.yaml \dataset=glue_qnli \model=unit \training.batch_size=8 \training.device=xla \distributed.world_size=1 \training.log_interval=100 \training.max_updates=1500
Observation
[32m2021-07-02T00:57:22 | mmf.trainers.callbacks.logistics: ^[[0mprogress: 1400/1500, train/glue_qnli/loss_0: 0.5864, train/glue_qnli/loss_0/avg: 0.6918, train/total_loss: 0.5864, train/total_loss/avg: 0.6918, experiment: run, epoch: 1, num_updates: 1400, iterations: 1400, max_updates: 1500, lr: 0.00003, ups: 7.69, time: 13s 846ms, time_since_start: 26m 41s 634ms, eta: 14s 082ms^[[32m2021-07-02T00:57:36 | mmf.trainers.callbacks.logistics: ^[[0mprogress: 1500/1500, train/glue_qnli/loss_0: 0.5864, train/glue_qnli/loss_0/avg: 0.6748, train/total_loss: 0.5864, train/total_loss/avg: 0.6748, experiment: run, epoch: 1, num_updates: 1500, iterations: 1500, max_updates: 1500, lr: 0.00004, ups: 7.69, time: 13s 593ms, time_since_start: 26m 55s 228ms, eta: 0ms
With the .equal op fixed, we see an improvement in the training performance. Notice that for 1500 steps, the training takes over 26 minutes, and the updates per sec reported for the final 100 steps is 7.69. Update per sec improves by about 7X, but training time has not reduced by the same degree. It is because of the graph recompilations in the initial few steps, the training still runs slower. However, after a few hundred steps, graph caching starts to pay off, and the training stabilizes at a higher rate of updates per sec. Measurement with a few thousand steps will start to reflect similar factors of improvement in the overall training time.
Dynamic Graph
From the foundations discussed in part-I, you recall that if the Intermediate Representation (IR) graph recorded from the lazy tensor is dynamic, i.e. changes from one step to the next frequently (in worst case, every step), PyTorch/XLA performance deteriorates due to frequent recompilation (compilation of HLO graph to LLO graph and then to TPU executable). The framework works best if you can compile once and execute often, leveraging the graph caching and XLA optimizations for speedups.
In this case study, we also have the opportunity to examine a scenario with a dynamic graph. Once the training portion of the run is completed and evaluation starts, you may notice that evaluation seems to be running noticeably slower than the training. Since evaluation only executes the forward pass, we expect it to be faster, so what’s wrong here?
The two usual suspects of slow execution are – frequent device to host transfers and frequent compilation. PyTorch/XLA profiler when enabled via PT_XLA_DEBUG=1 provides helpful messages to understand what could be improved. You will notice messages similar to the following during evaluation:
2021-09-30T02:28:22 | mmf.trainers.mmf_trainer: Starting inference on test set2021-09-30T02:28:22 | mmf.common.test_reporter: Predicting for glue_qnli…pt-xla-profiler: CompileTime too frequent: 11 counts during 12 stepspt-xla-profiler: CompileTime too frequent: 12 counts during 13 stepspt-xla-profiler: CompileTime too frequent: 13 counts during 14 stepspt-xla-profiler: CompileTime too frequent: 14 counts during 15 stepspt-xla-profiler: CompileTime too frequent: 15 counts during 16 stepspt-xla-profiler: CompileTime too frequent: 16 counts during 17 steps
Note that the CompileTime metric seems to be linearly increasing with the step count. So the area to investigate is frequent compilations. We can conclude that the graph underlying the evaluation is a dynamic graph. Note that in case of an op with no XLA lowering, both device to host transfer and compile time will be frequent (As a helpful exercise, the reader should try to understand herself/himself on why this is the case).
At this point, thanks to your familiarity with the source code you can potentially leap in the right direction if not exactly point out the dynamic structure in your code. To aid your investigation you can insert the following snippet to print CompileTime metric samples before and after certain portions of your source code where you suspect a dynamic structure.
import torch_xla.debug.metrics as metprint(f"Number of compilations: {met.metric_data('CompileTime')[:1]})
Readers are encouraged to pause here and consider investigating mmf source code for a potential dynamic structure (Hint: it happens only during evaluation).
With a few iterations or less you must have discovered:
def accumulate_tensor_fields_and_loss(self, report: "Report", field_list: List[str]):for key in field_list:if key == "__prediction_report__":continueif key not in self.keys():warnings.warn(f"{key} not found in report. Metrics calculation "+ "might not work as expected.")continueif isinstance(self[key], torch.Tensor):self[key] = torch.cat((self[key], report[key]), dim=0)self._accumulate_loss(report)
‘self’ in this example refers to a report object. At every evaluation step, self[key] appends a tensor to the existing self[key]. Such operations are not uncommon for global metric computation.
How to solve this problem?
Each dynamic graph example is unique, and therefore the emphasis here is not on the solution but on the analysis. However, here is a general approach which may be helpful to consider. Consider the following pattern:
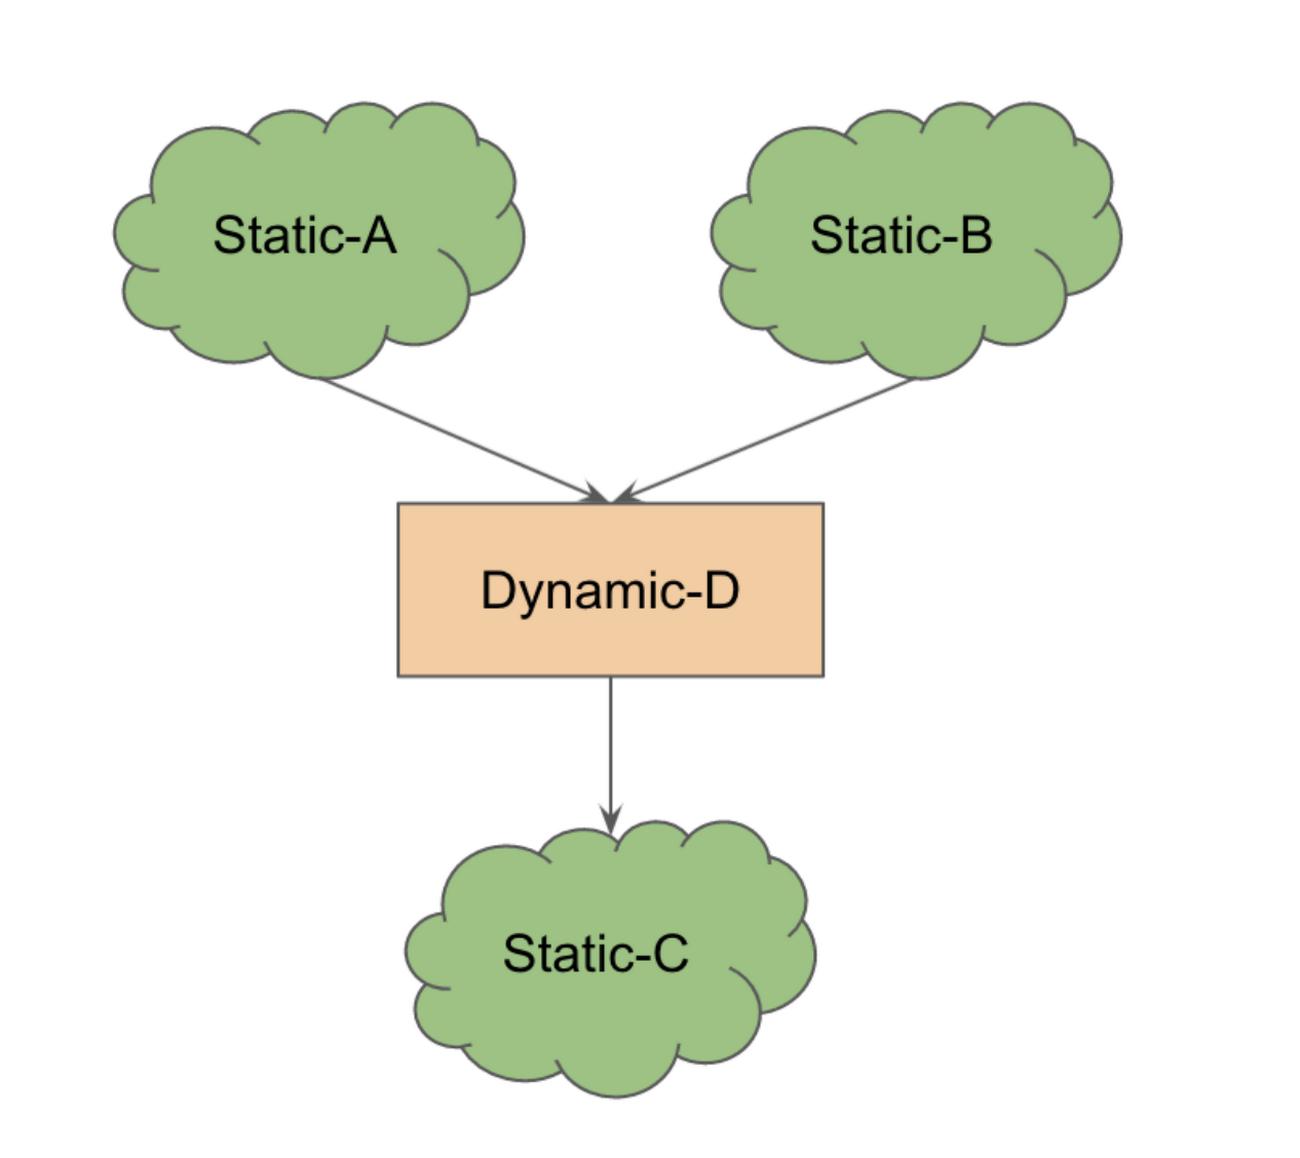
Static subgraphs A and B input into a structure D which is dynamic (D) and outputs to another subgraph C. If this whole graph is executed at once, because of the dynamic component the recompilation will be triggered. However, if it’s possible to execute the static subgraphs (on device) before the dynamic structure execution on the host (CPU), we trade off compilation time penalty with the device to host transfer penalty. If this trade off is substantial it can still speed up the overall execution.
This is a pattern that PyTorch/XLA automatically uses for the ops which have no equivalent XLA implementation (lowering op). As stated earlier, the best alternative is to consider rewriting the dynamic structure such that it does not change at every step of the execution.
Fortunately, the mmf library allows a CPU execution feature which allows report object accumulation on CPU and executes the rest of the graph on the device (TPU). You can enable it in the following way:
export USE_TORCH=ONexport PT_XLA_DEBUG=1export XRT_TPU_CONFIG="localservice;0;localhost:51011"python3 mmf_cli/run.py \config=./projects/unit/configs/all_8_datasets/shared_dec_without_task_embedding.yaml \dataset=glue_qnli \model=unit \training.batch_size=8 \training.device=xla \distributed.world_size=1 \training.log_interval=10 \training.max_updates=10 \evaluation.use_cpu=True
Please note that all the forward graph execution still happens on TPU except for the report object accumulation. You will notice that this leads to a significant speed up in the evaluation (from 5.81 sec/it to 23.56it/sec). You will also notice the following message in the log:
pt-xla-profiler: TransferFromServerTime too frequent: 4091 counts during 692 stepspt-xla-profiler: TransferFromServerTime too frequent: 4097 counts during 693 stepspt-xla-profiler: TransferFromServerTime too frequent: 4097 counts during 694 steps
This is expected because one device to host transfer for the report object entails multiple transfers (one for each object in the report dictionary). There are a ‘significant number of device-to-host’ transfers, however 100s of occurrences of compilation are saved and hence the speedup.
What’s Next?
In this part of the article series we started with the part-I exercise and introduced a few more concepts to understand how we use the clues from the PyTorch/XLA profiler to find execution bottlenecks and potentially reduce these bottlenecks. Although, in the dynamic graph example we presented in this article, a certain characteristic of the graph allowed us to trade off compilation penalty with device-to-host transfer penalty. It should be noted that such patterns may not always occur and the best practice is to avoid dynamic structure in the model graph as far as possible.
As an exercise, the reader is encouraged to further analyze the local_scalar_dense stack trace reported by the profiler and study to code for potential opportunities to further improve the training performance. In the final part of this series, we will study server-side profiling and annotation traces.
Until next time, Happy Hacking! Have a question or want to chat? Find me on LinkedIn.
By: Vaibhav Singh (Machine Learning Specialist, Outbound Product Manager)
Source: Google Cloud Blog
For enquiries, product placements, sponsorships, and collaborations, connect with us at [email protected]. We'd love to hear from you!
Our humans need coffee too! Your support is highly appreciated, thank you!