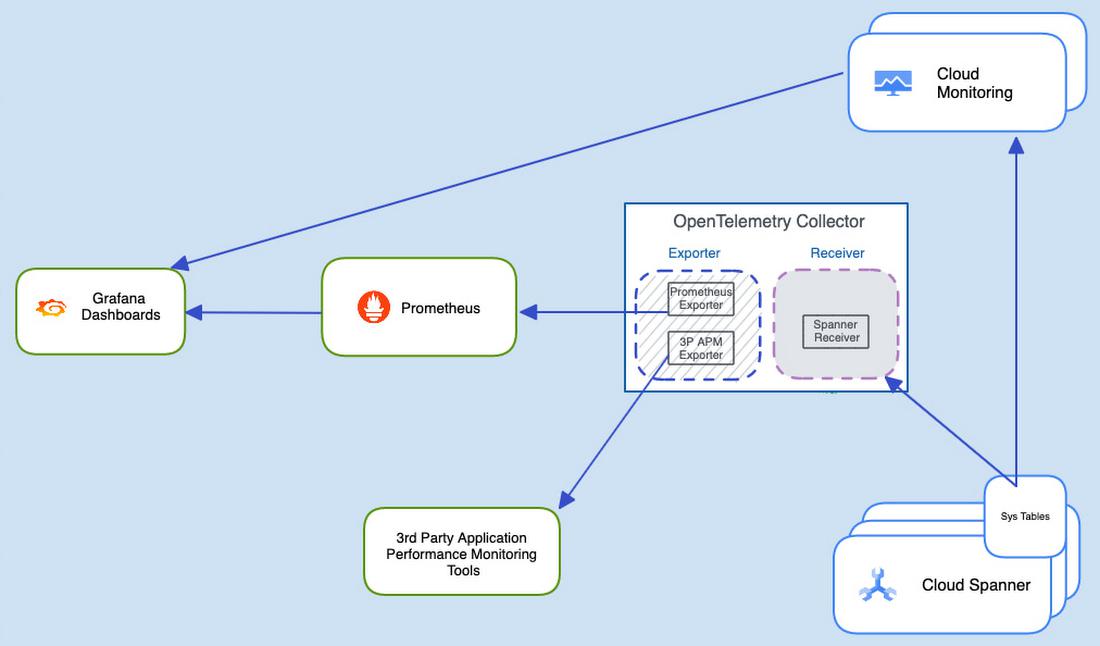
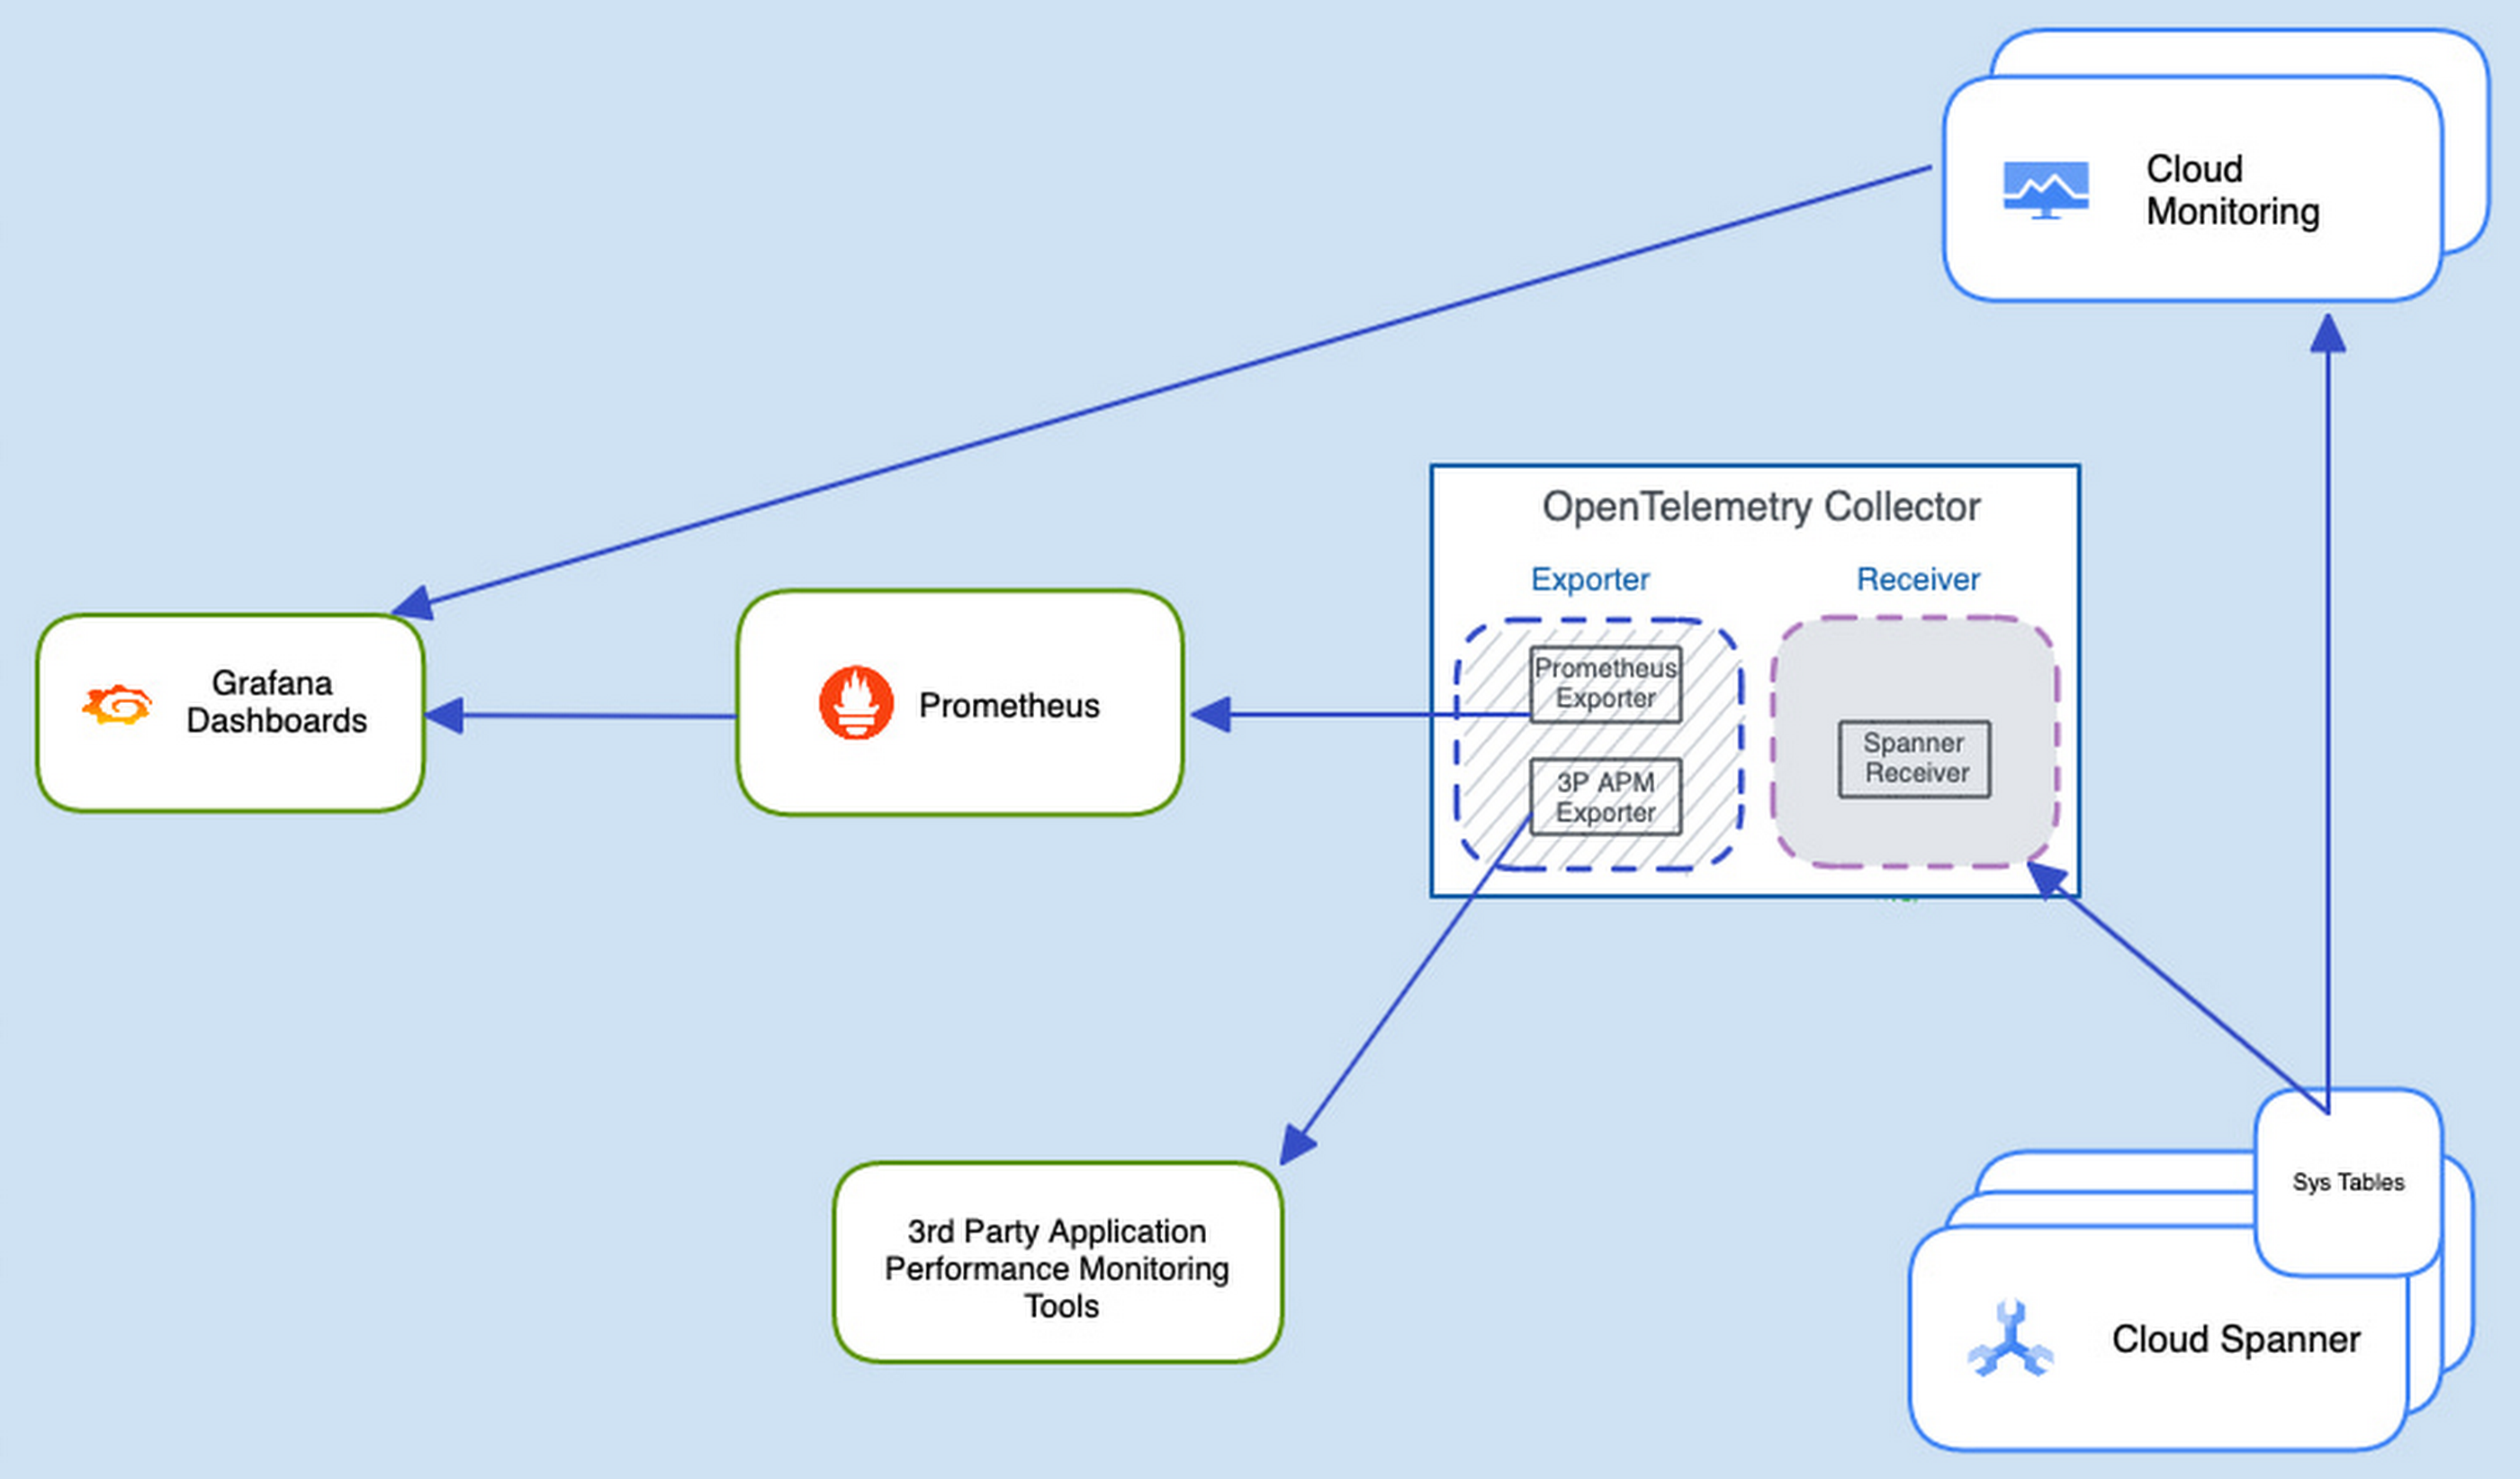
Today we’re announcing the launch of an OpenTelemetery receiver for Cloud Spanner, which provides an easy way for you to process and visualize metrics from Cloud Spanner System tables, and export these to the APM tool of your choice. We have also built a reference integration with Prometheus and sample Grafana dashboards which customers can use as a template for their own troubleshooting needs. This receiver is available starting version v0.41.0
Whether you are a database admin or a developer, it is important to have tools that help you understand the performance of your database, detect if something goes wrong (elevated latencies, increased error rates, reduced throughput etc), and identify the root cause of these signals. Cloud Spanner offers a wide portfolio of Observability tools that allow you to easily monitor database performance, diagnose and fix potential issues.
From our partners:
However, some of our customers would like to have the flexibility of consuming Cloud Spanner metrics in their own observability tooling, which could be either an open source combination of a time-series database like Prometheus coupled with a Grafana dashboard, or it could be a commercial Application Monitoring (APM) tool like Splunk, Datadog, Dynatrace, NewRelic or AppDynamics. The reason is that, organizations have already invested in their own observability tooling and don’t want to switch, since switching to a different vendor or a visualization console will require spending a great deal of effort. This is where OpenTelemetry comes in.
OpenTelemetry is a vendor-agnostic observability framework for instrumenting, generating, collecting, and exporting telemetry data (traces, metrics and logs). It integrates with many libraries and frameworks across various languages to offer a large set of automatic instrumentation capabilities.
The OpenTelemetry Receiver
An OpenTelemetery receiver is a component of the OpenTelemetery Collector which is built on a Receiver-Exporter model, and by installing the new receiver for Cloud Spanner and configuring a corresponding exporter, developers can now export metrics to their APM tool of choice. This architecture offers a vendor-agnostic implementation on how to receive, process, and export telemetry data. It removes the need to run, operate, and maintain multiple agents / collectors which send traces and metrics in proprietary formats to one or more tracing and/or metrics backends.
Cloud Spanner has a number of introspection tools in the form of System Tables (built-in tables that you can query to gain helpful insights about operations in Spanner such as queries, reads, and transactions). Now, with the introduction of the OpenTelemetry receiver for Cloud Spanner, developers can now consume these metrics and visualize them in their APM tool.
Reference Implementation
As a reference implementation, we have created a set of sample dashboards on Grafana, which consume metrics both from Prometheus (exported by the OpenTelemetery Collector) and Cloud monitoring to enable an end-to-end debugging experience.
NOTE: Instead of deploying a self managed instance of Prometheus, customers can now also use Google’s managed service for Prometheus. Using this service will let you monitor and alert on your workloads, using Prometheus, without having to manually manage and operate Prometheus at scale. Learn more about using this service here.
Prerequisites
- Prometheus installed and configured.
- OpenTelemetry version v0.41.0 (or higher).
Here are the specific configurations of these components:
OpenTelemetry collector
Below is a sample configuration file that enables the receiver and sets up an endpoint for Prometheus to scrape metrics from.
[config.yml]
receivers:googlecloudspanner:collection_interval: 60stop_metrics_query_max_rows: 100# backfill_enabled: trueprojects:- project_id: "<YOUR_PROJECT>"service_account_key: "<SERVICE_ACCOUNT_KEY>.json"instances:- instance_id: "<YOUR_INSTANCE>"databases:- "<YOUR_DATABASE>"exporters:prometheus:send_timestamps: trueendpoint: "0.0.0.0:8889"logging:loglevel: debugprocessors:batch:send_batch_size: 200service:pipelines:metrics:receivers: [googlecloudspanner]processors: [batch]exporters: [logging, prometheus]
Prometheus
On Prometheus, you need to add a scrape configuration like so:
[prometheus.yml]
global:scrape_interval: 15sscrape_configs:- job_name: "otel"honor_timestamps: truestatic_configs:- targets: ["collector:8888", "collector:8889"]
Grafana
Finally, you need to configure Grafana and add datasources and dashboards. Our reference dashboards use two data sources – Cloud monitoring and Prometheus. This sample configuration file can be used with the dashboards we’ve shared above.
[datasource.yml]
apiVersion: 1datasources:- name: Google Cloud Monitoringtype: stackdriveraccess: proxyjsonData:tokenUri: https://oauth2.googleapis.com/tokenclientEmail: <YOUR SERVICE-ACCOUNT EMAIL>authenticationType: jwtdefaultProject: <YOUR SPANNER PROJECT NAME>secureJsonData:privateKey: |<YOUR SERVICE-ACCOUNT PRIVATE KEY BELOW>-----BEGIN PRIVATE KEY----------END PRIVATE KEY------ name: Prometheustype: prometheus# Access mode - proxy (server in the UI) or direct (browser in the UI).access: proxyurl: http://prometheus:9090
Sample Dashboards
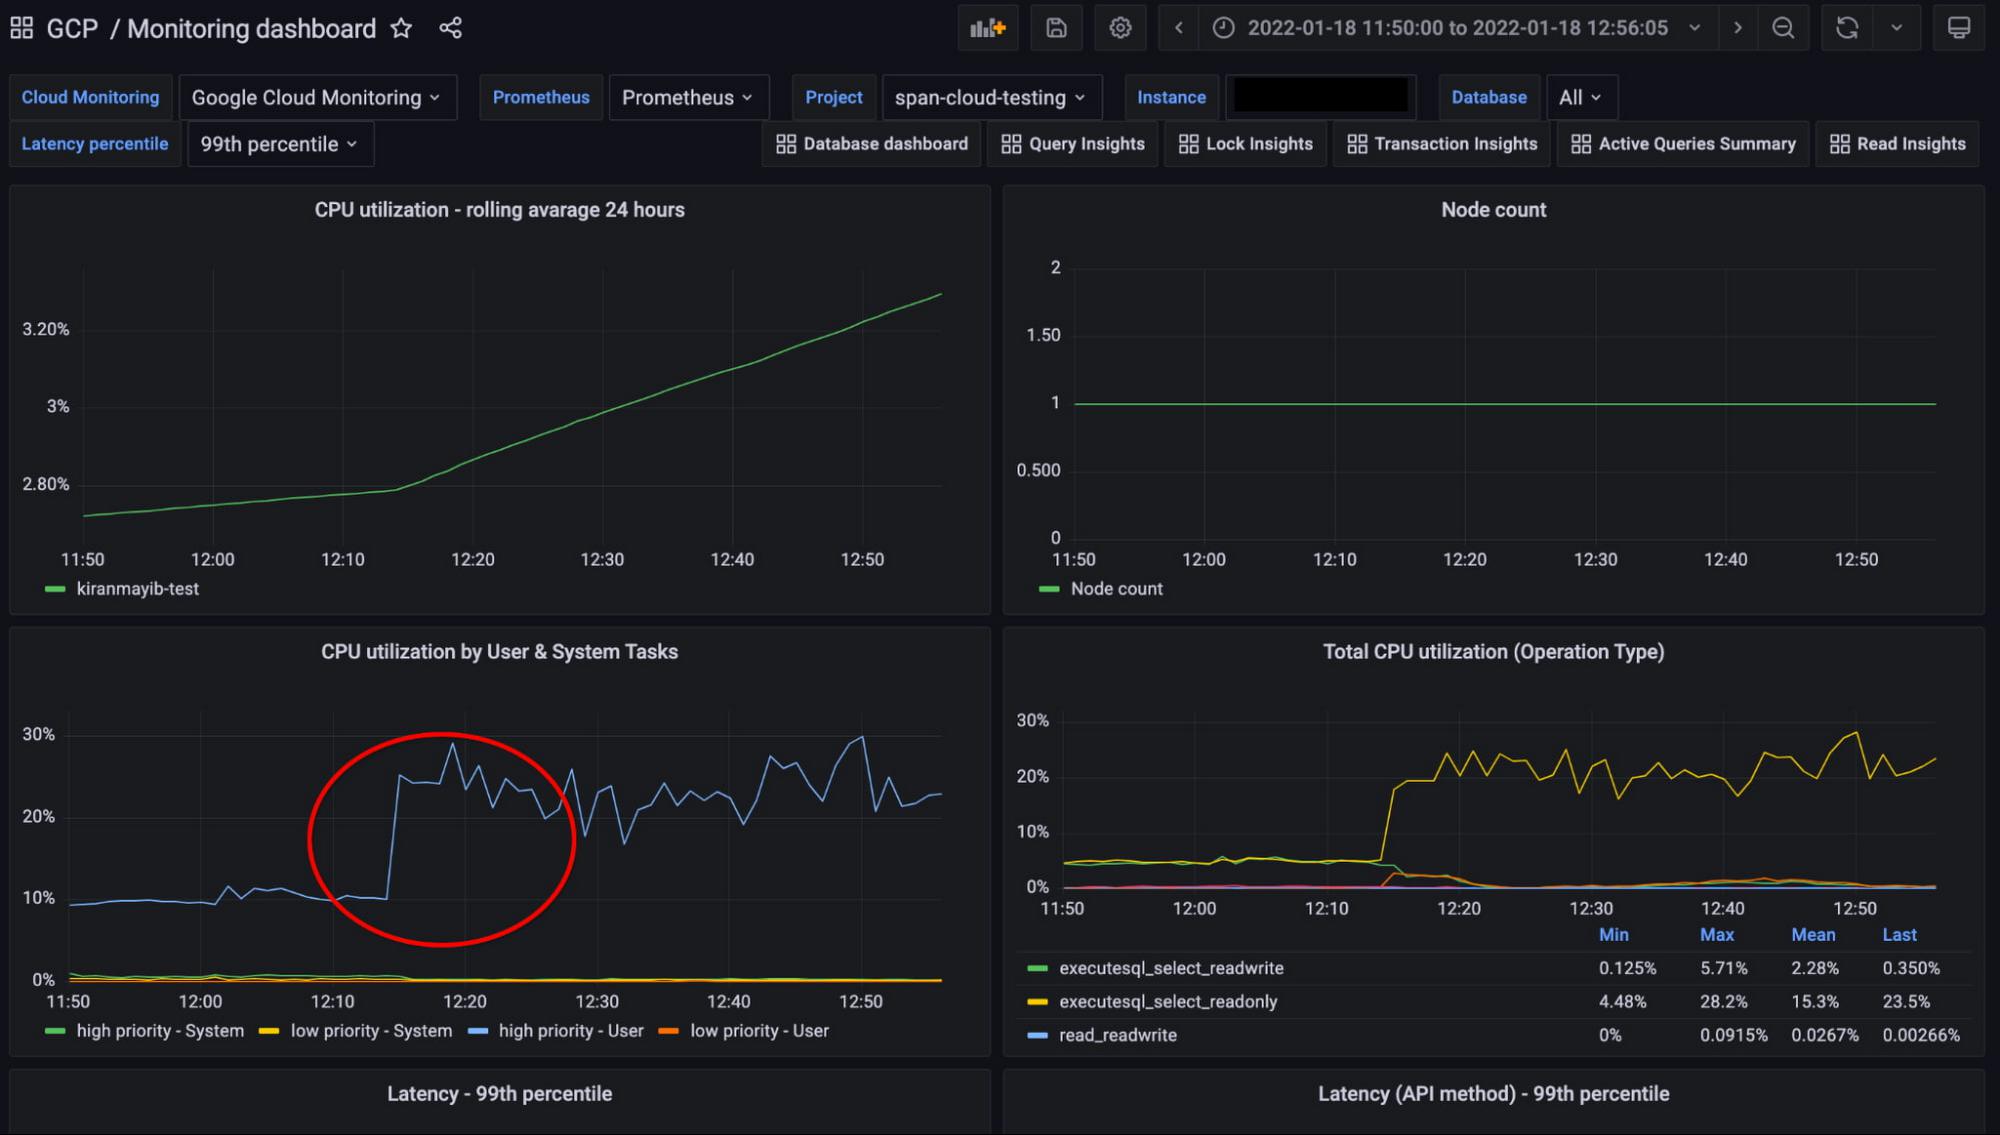
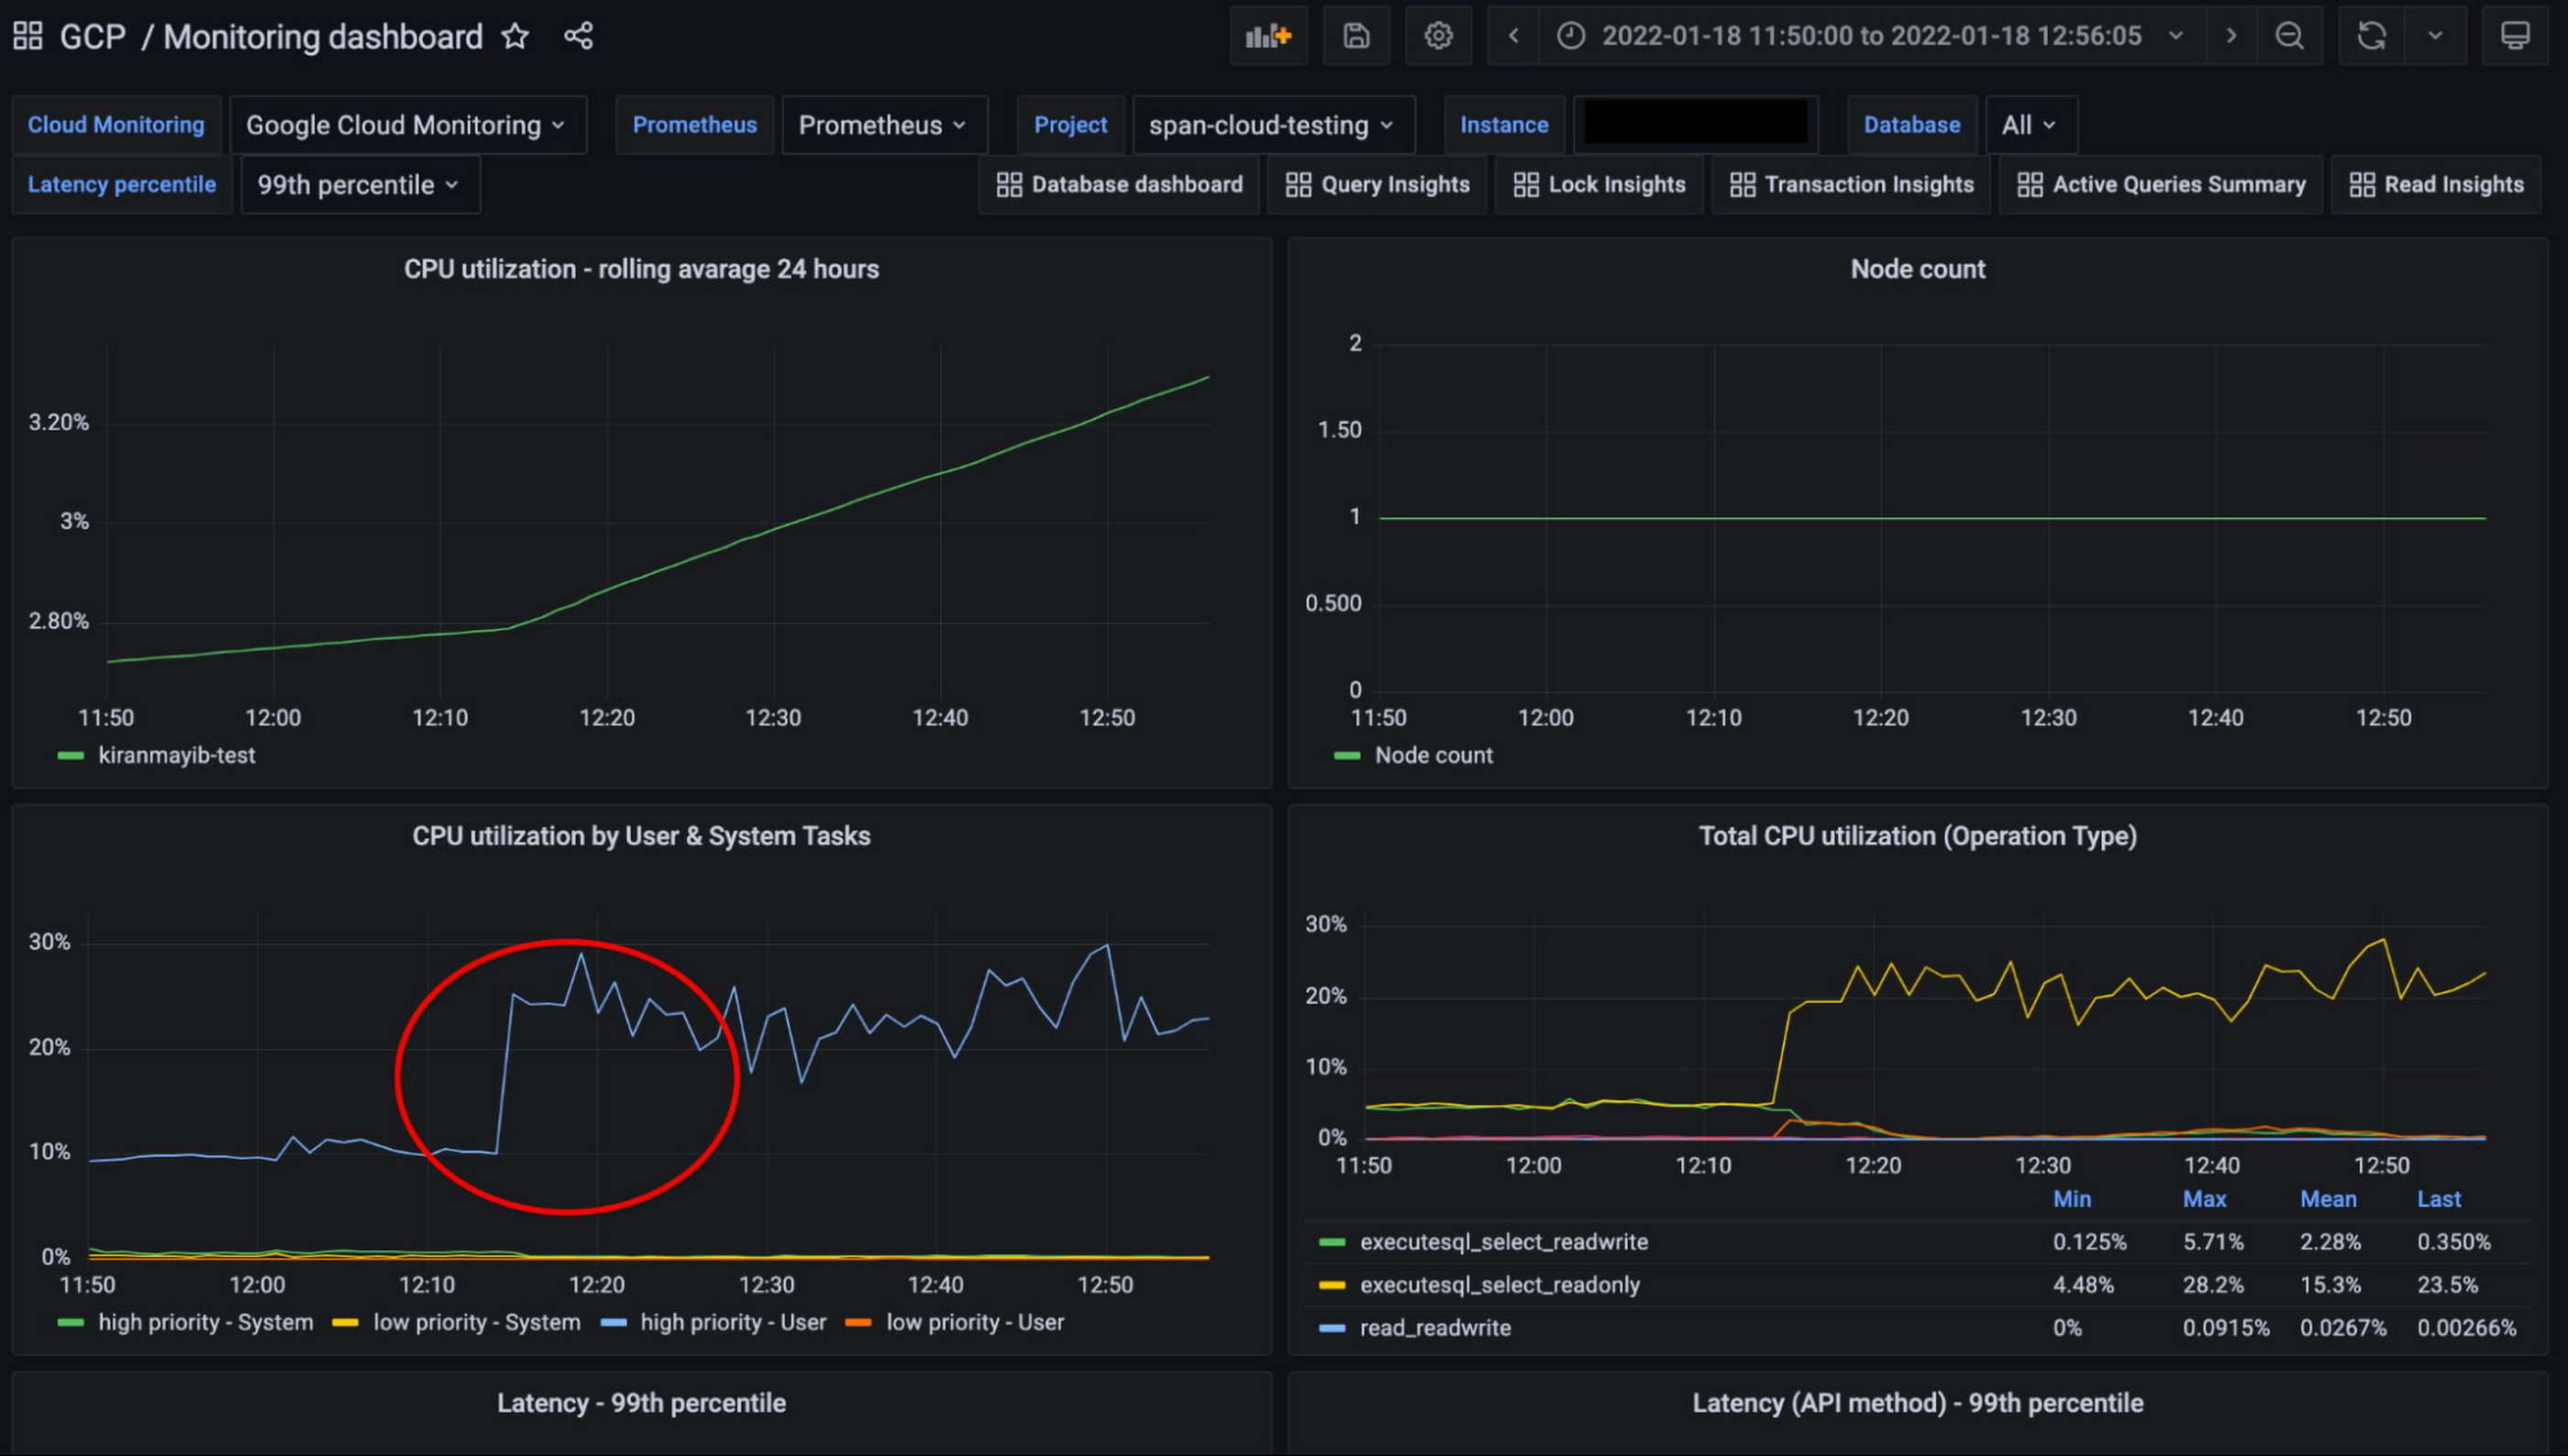
The monitoring dashboard powered by Cloud monitoring metrics.
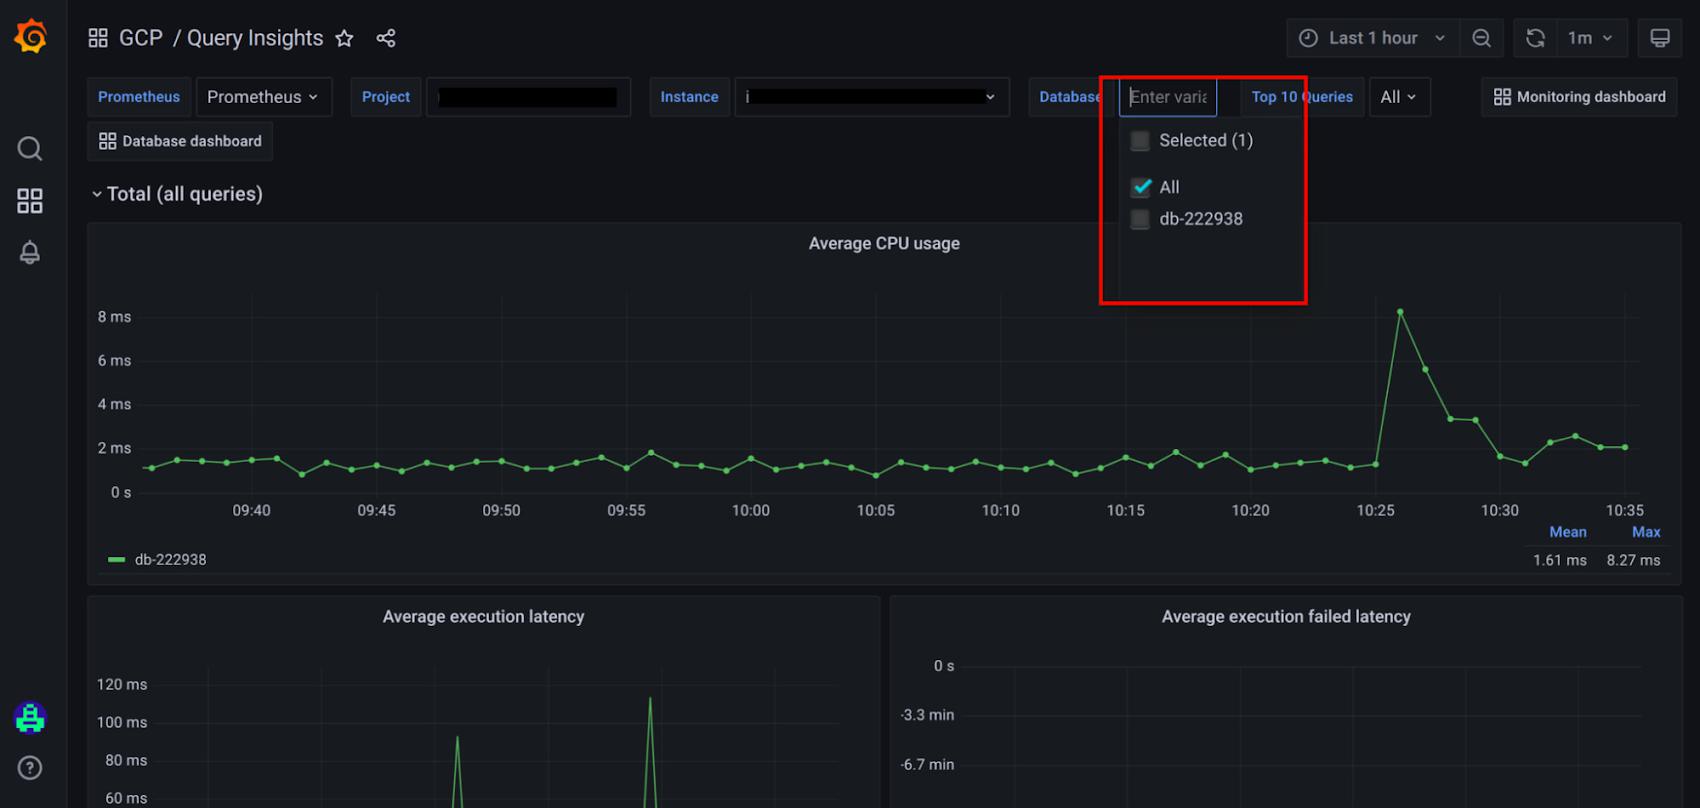
The Query Insights dashboard powered by Prometheus

We believe that a healthy observability ecosystem serves our customers well and this is reflected in our continued commitment to open-source initiatives. We’ve received the following feedback from the OpenTelemetry Community on this implementation:
“OpenTelemetry has grown from a proposal between two open-source communities to the north star for the collection of metrics and other observability signals. Google has strengthened their commitment to our community by constantly supporting OpenTelemetry standards. Using this implementation and the corresponding dashboards, developers can now consume these metrics in any tooling of their choice, and will be very easily able to debug common issues with Cloud Spanner.” —Bogdan Drutu, Co-Founder of OpenTelemetry
What’s next?
We will continue to provide flexible experiences to developers, embrace open standards, support our partner ecosystem and continue being a key contributor to the open source ecosystem. We will also continue to provide best-in-cloud native observability tooling in our console so that our customers get the best experience wherever they are.
To learn more about our Cloud Spanner’s introspection capabilities, read this blog post, and to learn more about Cloud Spanner in general, visit our website.
By: Mohit Gulati (Product Manager) and Mayank Khanwalker (Software Engineer)
Source: Google Cloud Blog
For enquiries, product placements, sponsorships, and collaborations, connect with us at [email protected]. We'd love to hear from you!
Our humans need coffee too! Your support is highly appreciated, thank you!