We’re thrilled to announce several new observability features for the Pub/Sub to Splunk Dataflow template to help operators keep a tab on their streaming pipeline performance. Splunk Enterprise and Splunk Cloud customers use the Splunk Dataflow template to reliably export Google Cloud logs for in-depth analytics for security, IT or business use cases. With newly added metrics and improved logging for Splunk IO sink, it’s now easier to answer operational questions such as:
- Is the Dataflow pipeline keeping up with the volume of logs generated?
- What is the latency and throughput (Event Per Second or EPS) when writing to Splunk?
- What is the response status breakdown of downstream Splunk HTTP Event Collector (HEC) and potential error messages?
This critical visibility helps you derive your log export service-level indicators (SLIs) and monitor for any pipeline performance regressions. You can also more easily root cause potential downstream failures between Dataflow & Splunk such as Splunk HEC network connections or server issues, and fix the problem before it cascades.
From our partners:
To help you quickly chart these new metrics, we’ve included them in the custom dashboard as part of the updated Terraform module for Splunk Dataflow. You can use those Terraform templates to deploy the entire infrastructure for log export to Splunk, or just the Monitoring dashboard alone.

More metrics
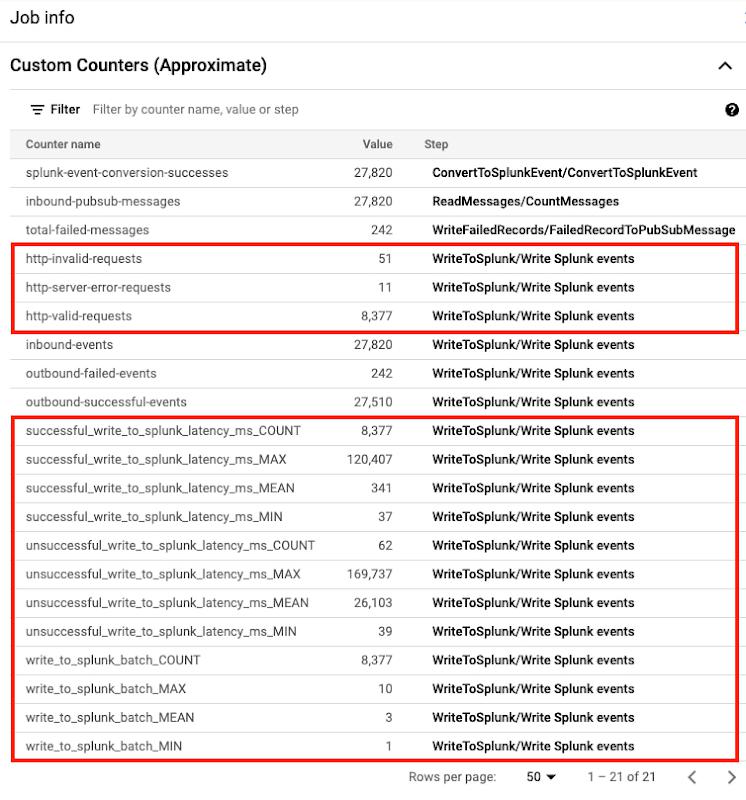
In your Dataflow Console, you may have noticed several new custom metrics (highlighted below) for launched jobs as of template version 2022-03-21-00_RC01, that is gs://dataflow-templates/2022-03-21-00_RC01/Cloud_PubSub_to_Splunk or later:

Pipeline instrumentation
Before we dive into the new metrics, let’s take a step back and go over the Splunk Dataflow job steps. The following flowchart represents the different stages that comprise a Splunk Dataflow job along with corresponding custom metrics:
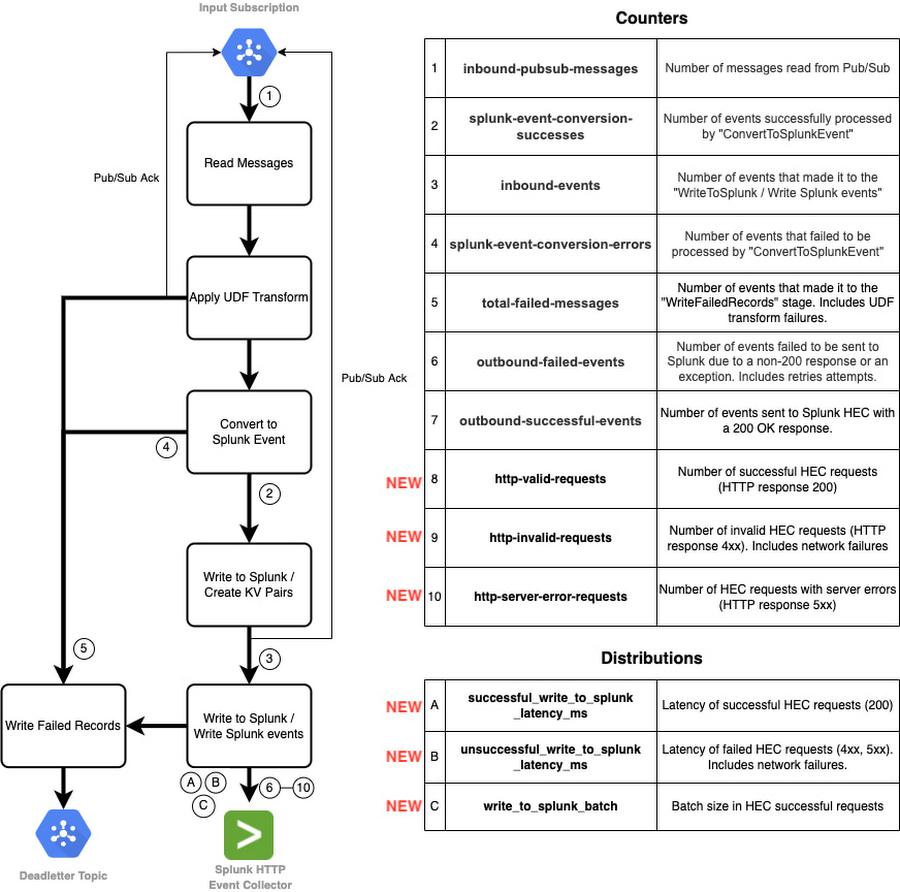
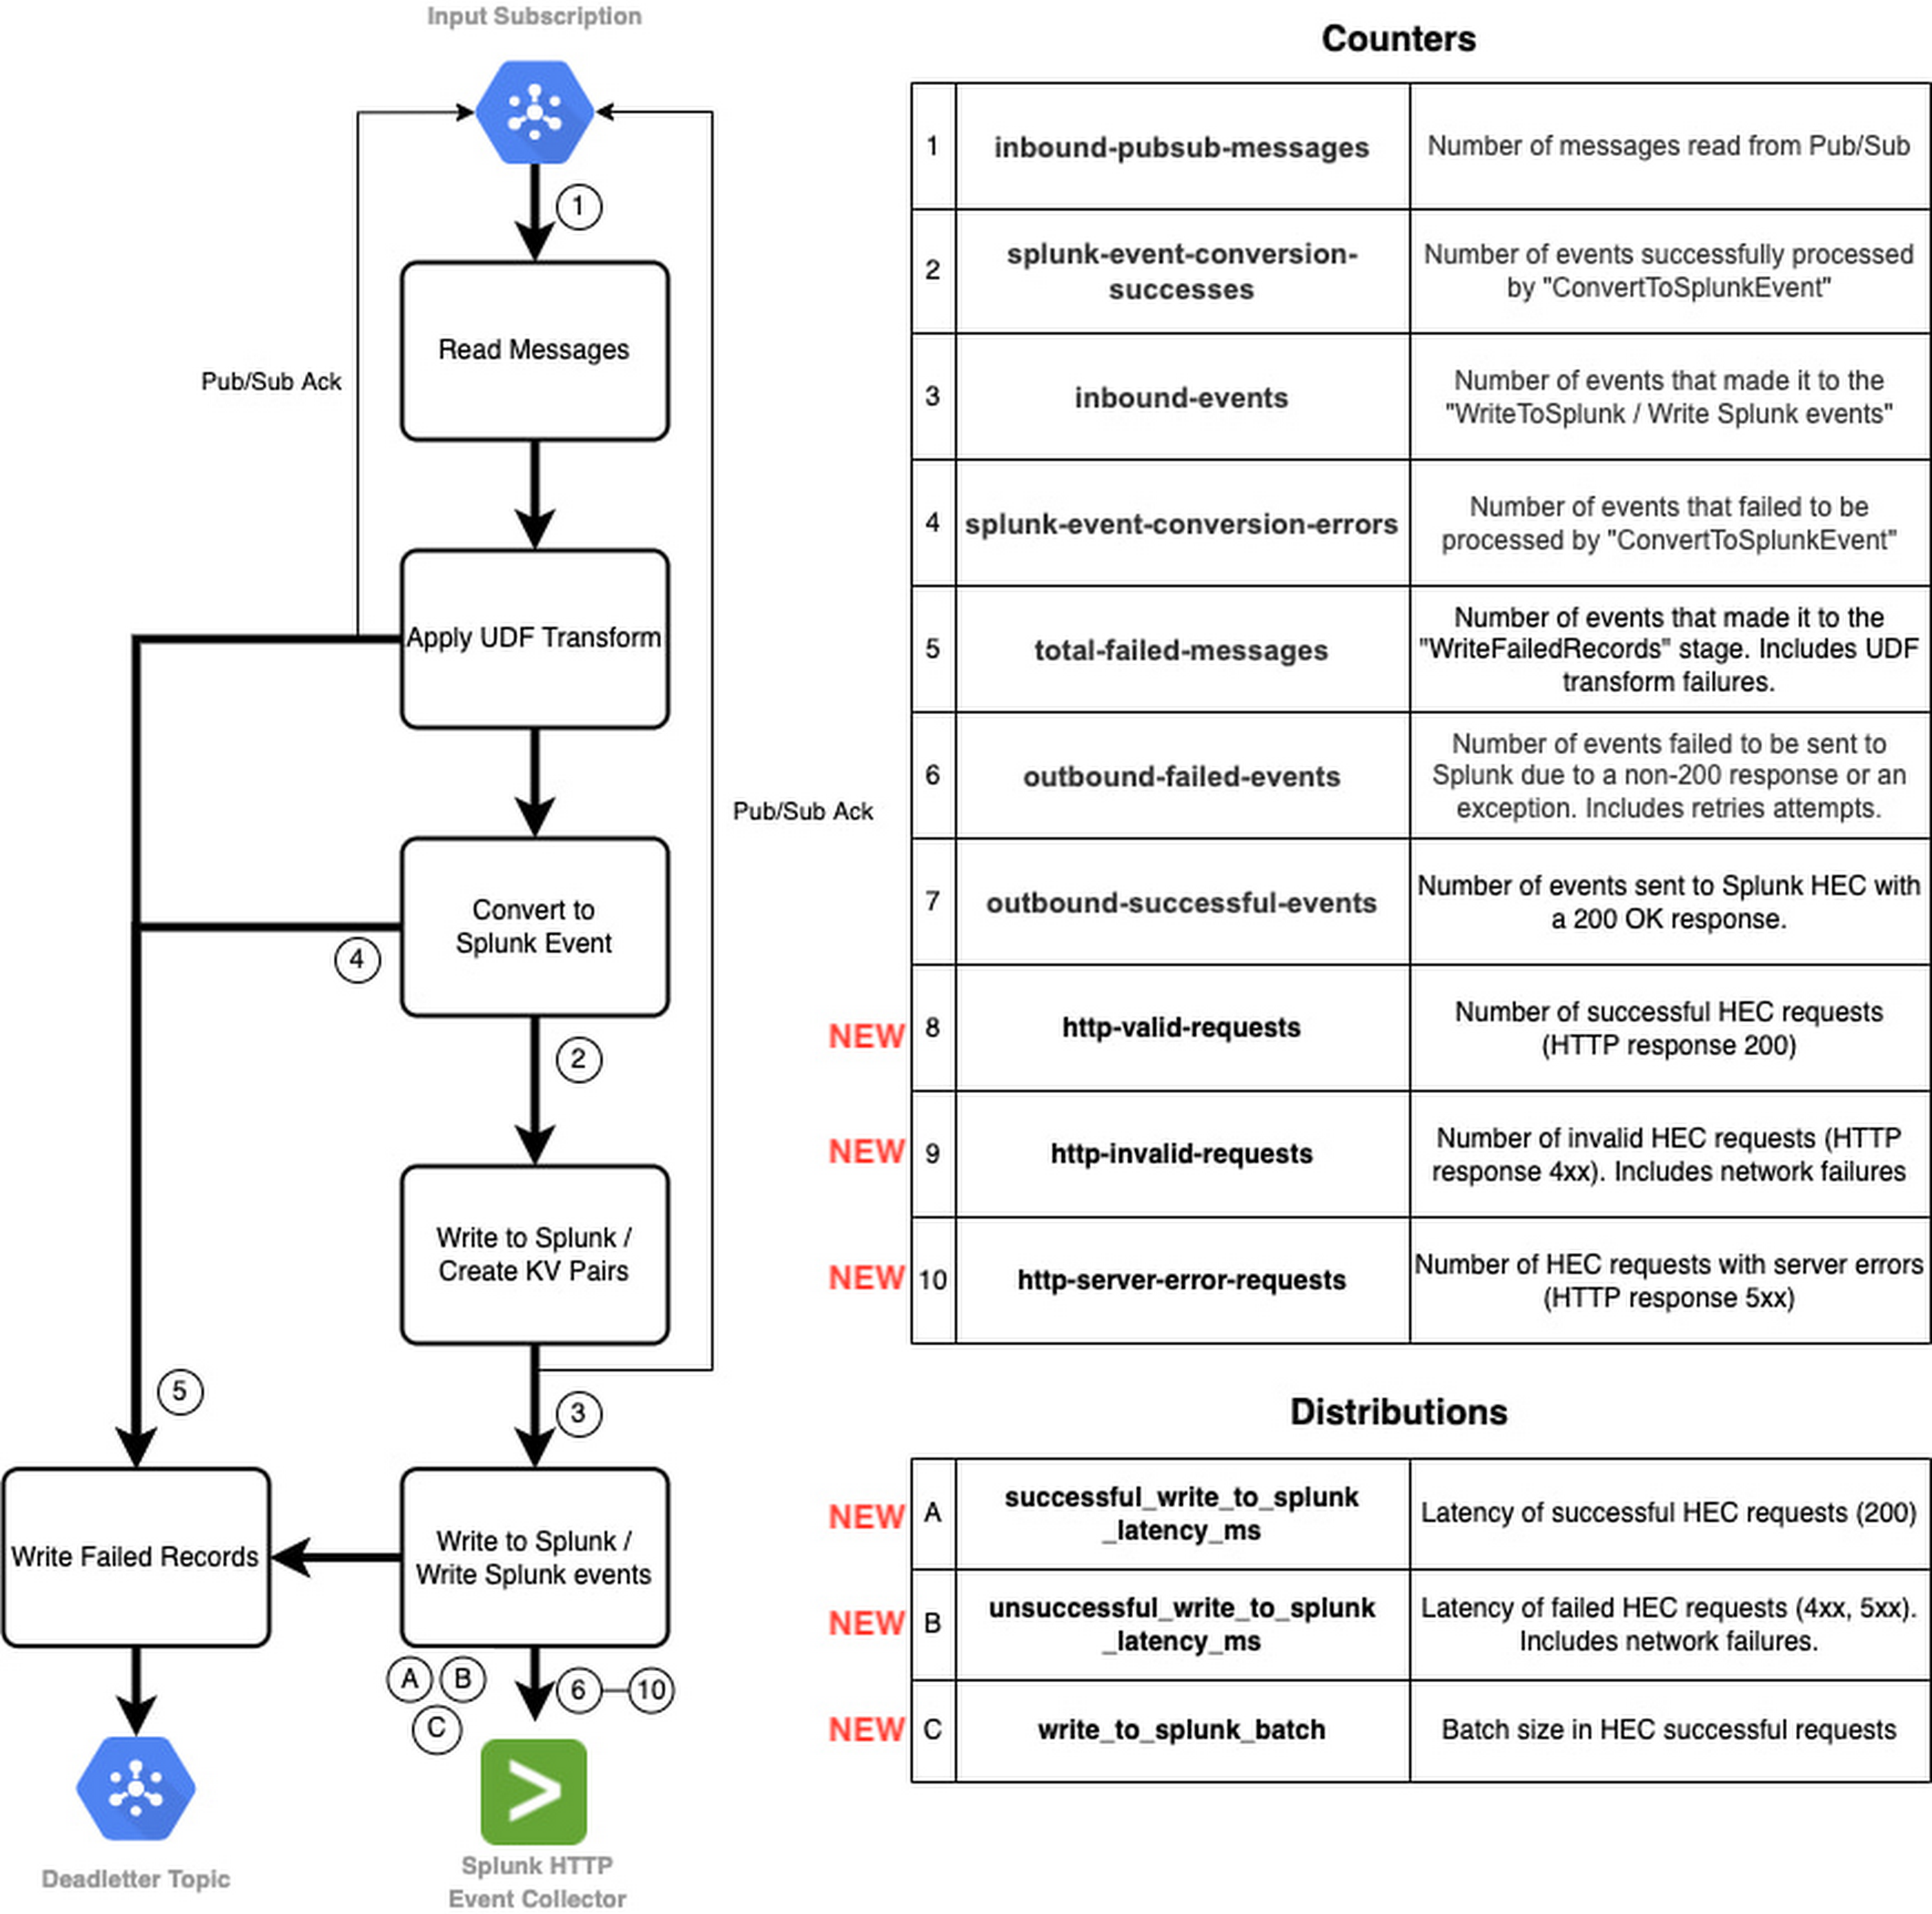
In this pipeline, we utilize two types of Apache Beam custom metrics:
- Counter metrics, labeled 1 through 10 above, used to count messages and requests (both successful and failed).
- Distribution metrics, labeled A through C above, used to report on distribution of request latency (both successful and failed) and batch size.
Downstream request visibility
Splunk Dataflow operators have relied on some of these pre-built custom metrics to monitor log messages progress through the different pipeline stages, particularly in the last stage Write To Splunk, with metrics outbound-successful-events (counter #6 above) and outbound-failed-events (counter #7 above) to track the number of messages that were successfully exported (or not) to Splunk. While operators had visibility of the outbound message success rate, they lacked visibility at the HEC request level. Splunk Dataflow operators can now monitor not only the number of successful and failed HEC requests over time, but also the response status breakdown to determine if request failed due to a client request issue (e.g. invalid Splunk index or HEC token), or a transient network or Splunk issue (e.g. server busy or down) all from Dataflow Console with the addition of counters #7-10 above, that is:
http-valid-requestshttp-invalid-requestshttp-server-error-requests
Splunk Dataflow operators can also now track average latency of downstream requests to Splunk HEC, as well as average request batch size, by using the new distribution metrics #A-C, that is:
successful_write_to_splunk_latency_msunsuccessful_write_to_splunk_latency_mswrite_to_splunk_batch
Note that a Distribution metric in Beam is reported by Dataflow as four sub-metrics suffixed with _MAX, _MIN, _MEAN and _COUNT. That is why those 3 new distribution metrics translate to 12 new metrics in Cloud Monitoring, as you can see in the earlier job info screenshot from Dataflow Console. Dataflow currently does not support creating a histogram to visualize the breakdown of these metrics’ values. Therefore, _MEAN metric is the only useful sub-metric for our purposes. As an all-time average value, _MEAN cannot be used to track changes over arbitrary time intervals (e.g. hourly), but it is useful to capture baseline, track trend or to compare different pipelines.
Dataflow custom metrics, including aforementioned metrics reported by Splunk Dataflow template, are a chargeable feature of Cloud Monitoring. For more information on metrics pricing, see Pricing for Cloud Monitoring.
Improved logging
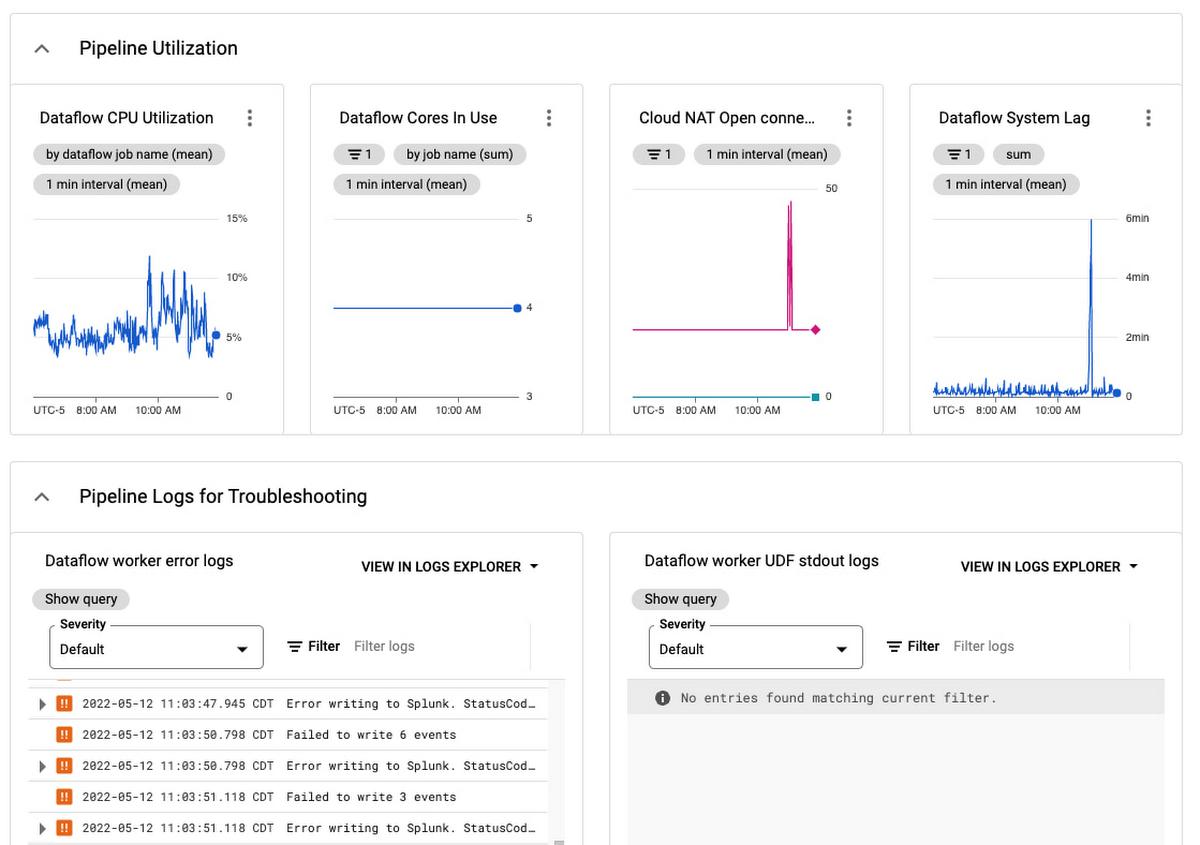
Logging HEC errors
To further root cause downstream issues, HEC request errors are now adequately logged, including both response status code and message:
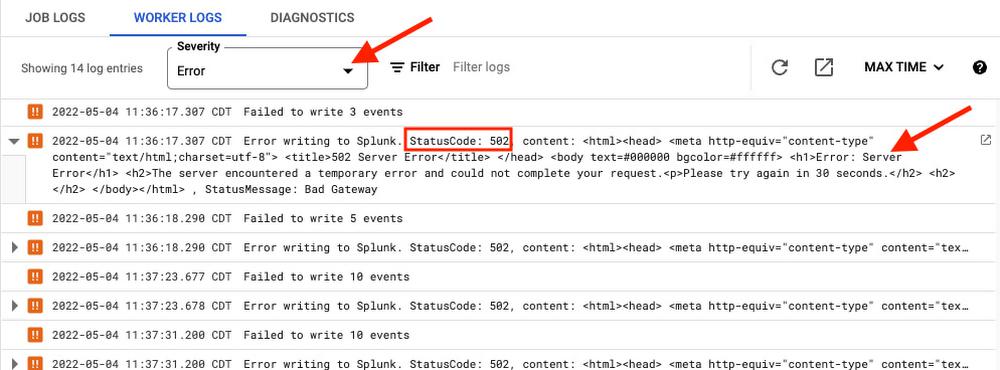
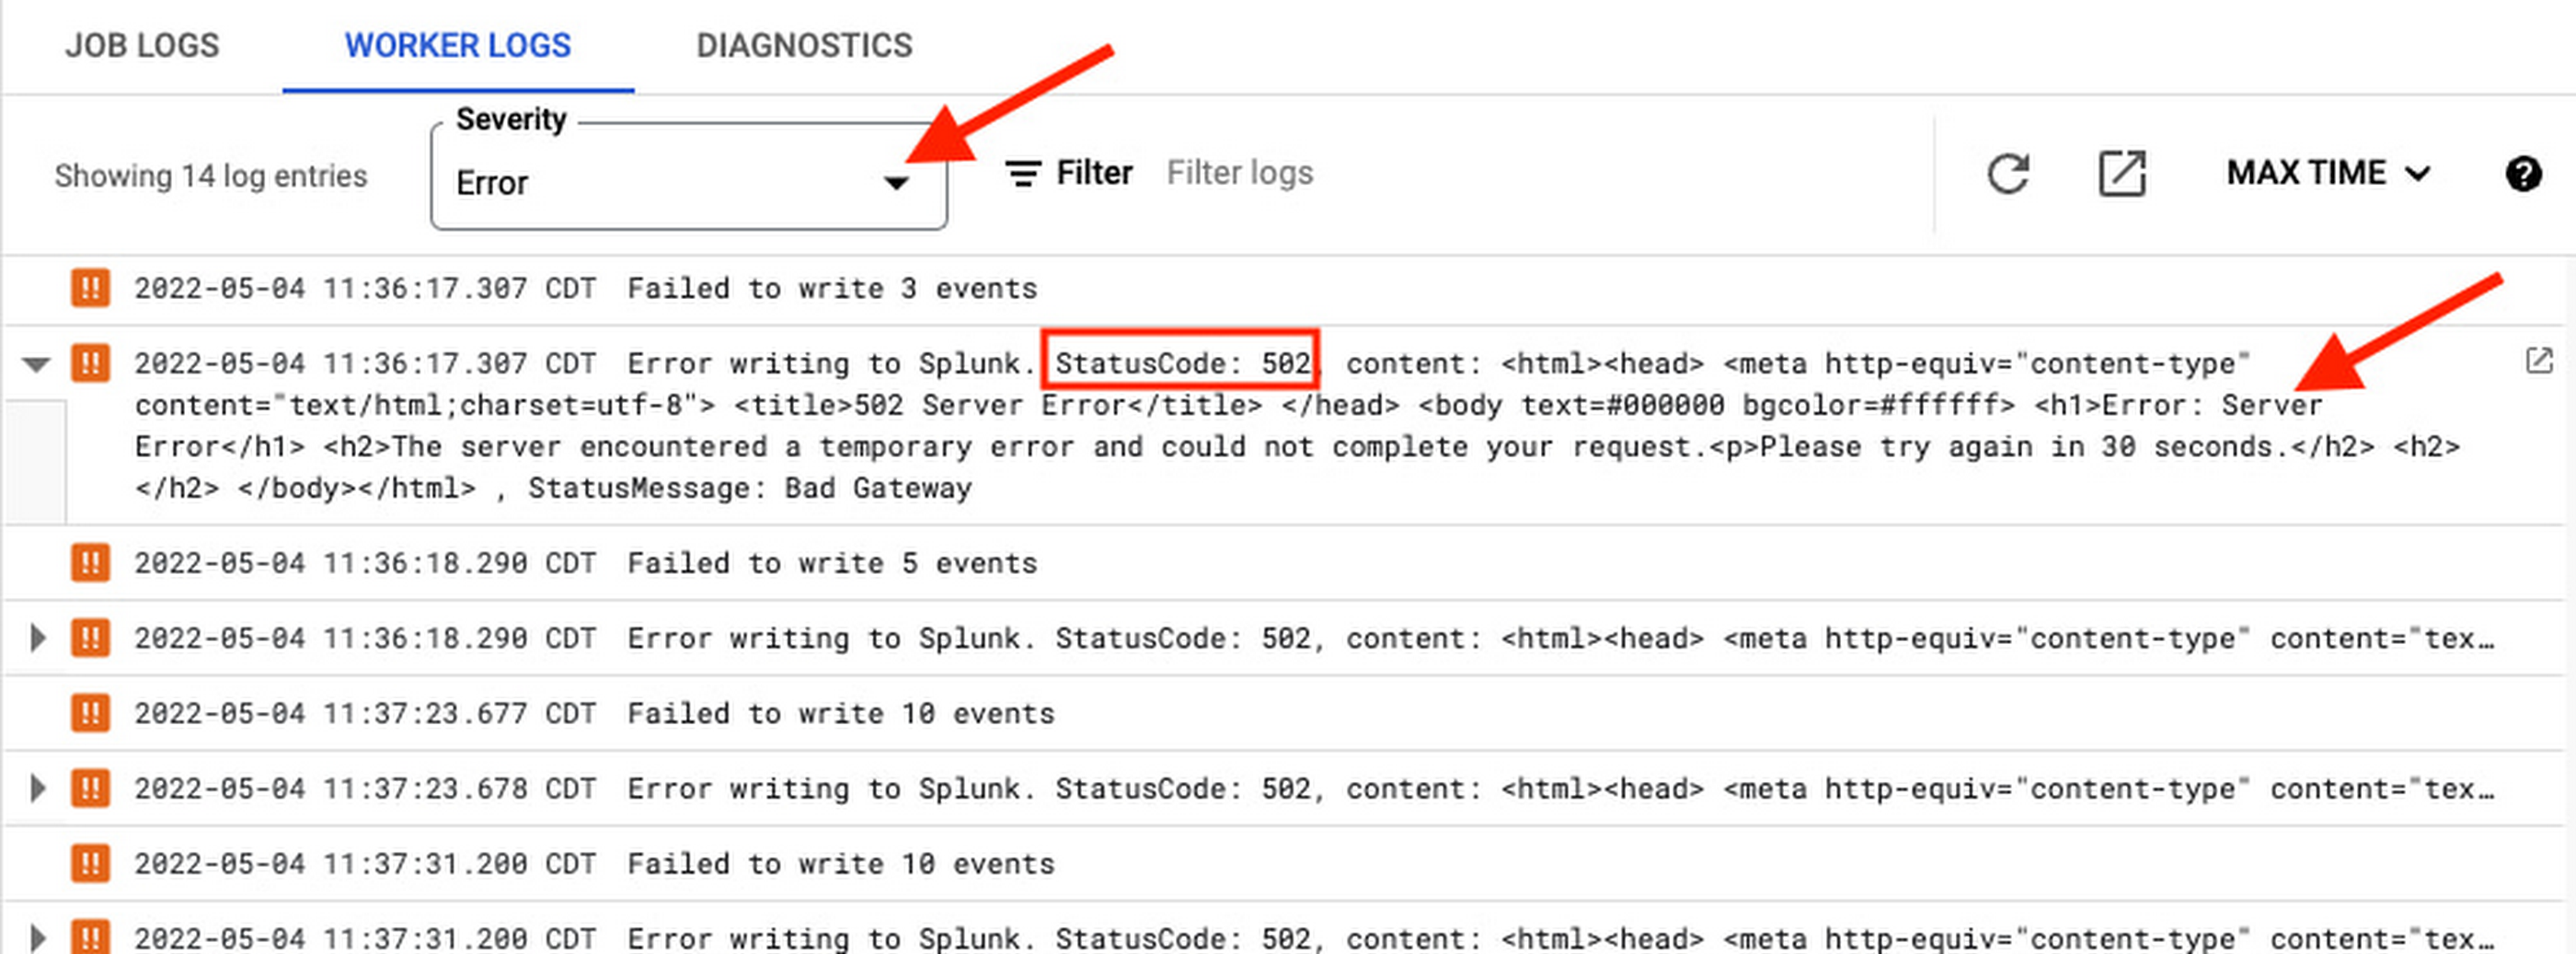
You can retrieve them directly in Worker Logs from Dataflow Console by setting log severity to Error.
Alternatively, for those who prefer using Logs Explorer, you can use the following query.
log_id("dataflow.googleapis.com/worker")resource.type="dataflow_step"resource.labels.step_id="WriteToSplunk/Write Splunk events"severity=ERROR
Disabling batch logs
By default, Splunk Dataflow workers log every HEC request as follows:
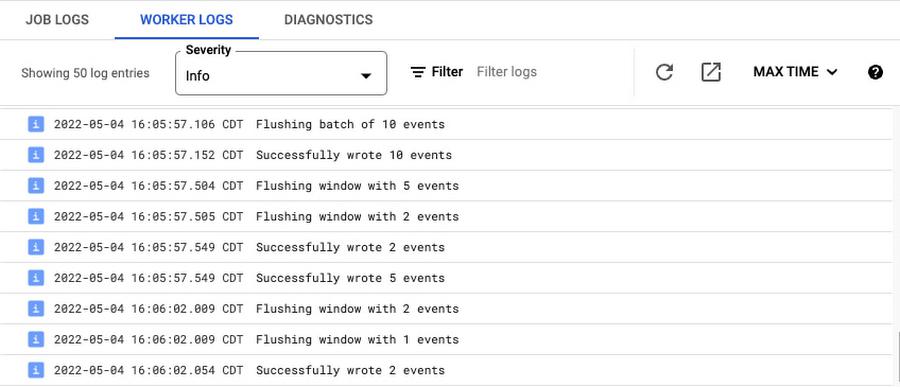

Even though these requests are often batched events, these ‘batch logs’ are chatty as they add 2 log messages for every HEC request. With the addition of request-level counters (http-*-requests), latency & batch size distributions, and HEC error logging mentioned above, these batch logs are generally redundant. To control worker log volume, you can now disable these batch logs by setting the new optional template parameter enableBatchLogs to false, when deploying the Splunk Dataflow job. For more details on latest template parameters, refer to template user documentation.
Enabling debug level logs
The default logging level for Google provided templates written using the Apache Beam Java SDK is INFO, which means all messages of INFO and higher i.e. WARN and ERROR will be logged. If you’d like to enable lower log levels like DEBUG, you can do so by setting the –-defaultWorkerLogLevel flag to DEBUG while starting the pipeline using gcloud command-line tool.
You can also override log levels for specific packages or classes with the –workerLogLevelOverrides flag. For example, the HttpEventPublisher class logs the final payload sent to Splunk at the DEBUG level. You can set the –workerLogLevelOverrides flag to {“com.google.cloud.teleport.splunk.HttpEventPublisher”:”DEBUG”} to view the final message in the logs before it is sent to Splunk, and keep the log level at INFO for other classes. Exercise caution while using this as it will log all messages sent to Splunk under the Worker Logs tab in the console, which might lead to log throttling or reveal sensitive information.
Putting it all together
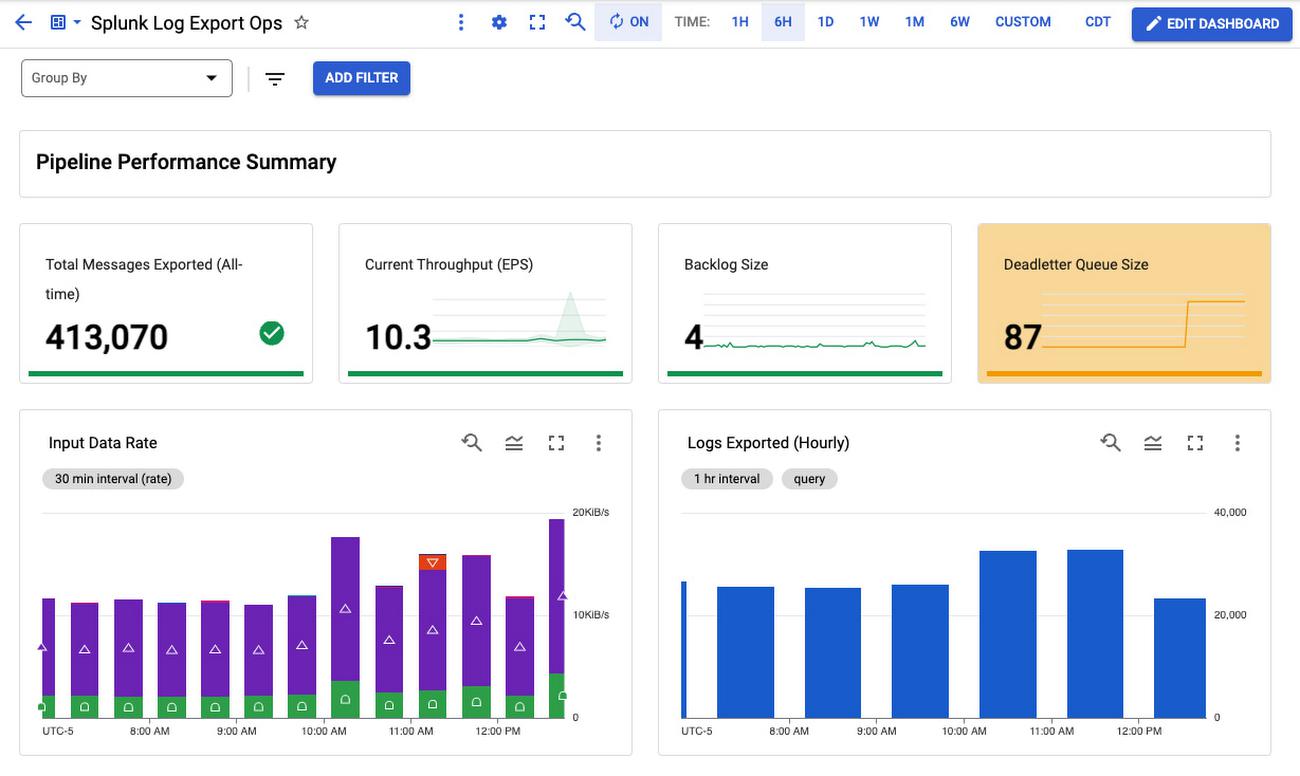
We put all this together in a single Monitoring dashboard that you can readily use to monitor your log export operations:
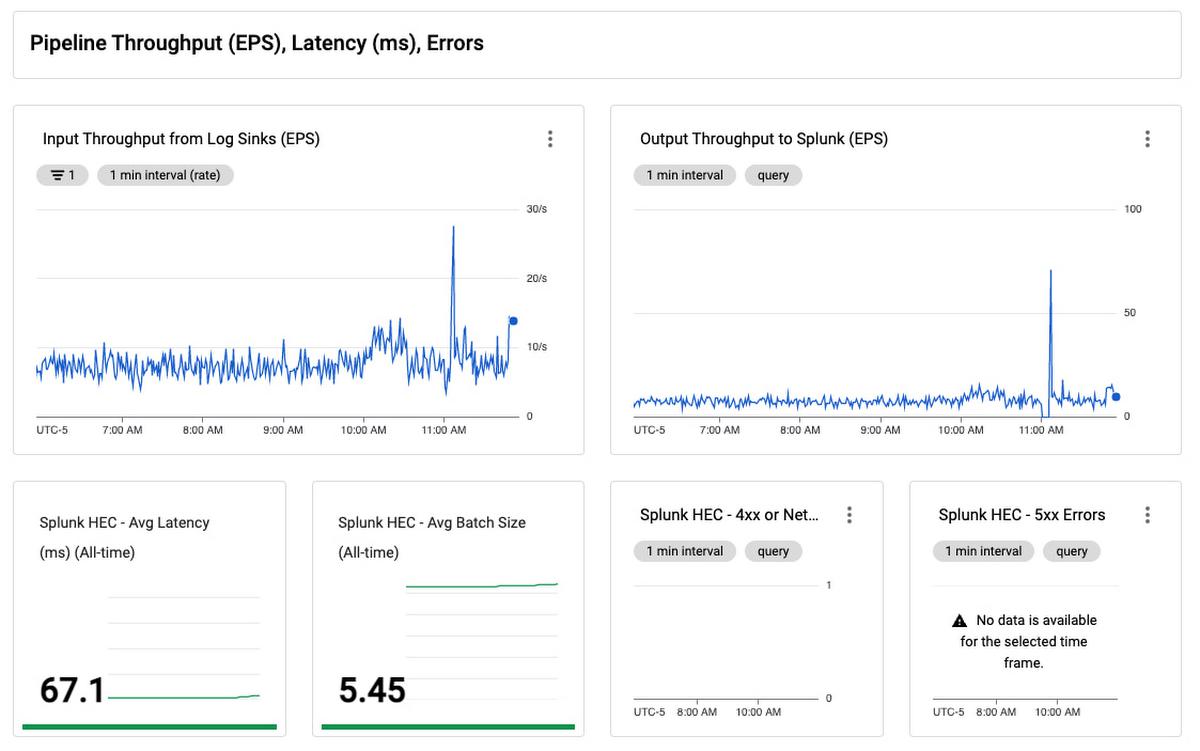

This dashboard is a single pane of glass for monitoring your Pub/Sub to Splunk Dataflow pipeline. Use it to ensure your log export is meeting your dynamic log volume requirements, by scaling to adequate throughput (EPS) rate, while keeping latency and backlog to a minimum. There’s also a panel to track pipeline resource usage and utilization, to help you validate that the pipeline is running cost-efficiently during steady-state.

For specific guidance on handling and replaying failed messages, refer to Troubleshoot failed messages as part of the Splunk Dataflow reference guide. For general information on troubleshooting any Dataflow pipeline, check out the Troubleshooting and debugging documentation, and for a list of common errors and their resolutions look through the Common error guidance documentation. If you encounter any issue, please open an issue in the Dataflow templates GitHub repository, or open a support case directly in your Google Cloud Console.
For a step-by-step guide on how to export GCP logs to Splunk, check out the Deploy production-ready log exports to Splunk using Dataflow tutorial, or use the accompanying Terraform scripts to automate the setup of your log export infrastructure along with the associated operational dashboard.
By: Roy Arsan (Solutions Architect)
Source: Google Cloud Blog
For enquiries, product placements, sponsorships, and collaborations, connect with us at [email protected]. We'd love to hear from you!
Our humans need coffee too! Your support is highly appreciated, thank you!