Editor’s note: Today we hear from Maisons du Monde, a furniture and home decor company that was founded in France over 25 years ago. They have 357 stores across France, Italy, Spain, Belgium, Luxembourg, Germany, Austria, Switzerland, Netherlands, and Portugal, and are a Google Cloud customer. They worked with their Customer Engineer, Adrien Aflalo, to prepare this story.
Without telemetry data like logs and metrics, we are blind in production. Our team of Operations Engineers and Site Reliability Engineers (SRE) rely on metrics data in particular to run the Maisons du Monde website, our APIs, and our omnichannel services in a secure and reliable manner. This means that choosing a metrics platform and provider is not just a technical decision, but one that’s critical to our business as well.
From our partners:
As we moved more of our operations to Google Kubernetes Engine, we evaluated new metrics platforms and about eight months ago decided on Prometheus. Prometheus is a good fit for our environment, which contains cloud native applications that are built on Kubernetes and run on ephemeral compute infrastructure. Although first we built and ran our own Prometheus environment, we decided that Google Cloud Managed Service for Prometheus is a better solution for us. It allows us to focus on using our metrics instead of managing metrics infrastructure, providing the following features:
- Long-term retention of metrics (2 years)
- Seamless support for high availability of Prometheus instances
- Scraping and evaluating rules using lightweight Kubernetes Custom Resources
- A global query view
- Fully managed collection and querying, out of the box
For other organizations that are running their own Prometheus or deciding whether to run their own Prometheus, we wanted to provide you a look into our journey moving from self-hosted Prometheus to using a managed Prometheus service:
- We first switched from traditional managed metrics services to Prometheus to support our growing Kubernetes environment.
- We then built out and maintained our own Prometheus environment, but realized we needed additional features to support production workloads (such as high availability and faster MTTR) and scale.
- Next we investigated solutions to help support our use of Prometheus in production, which led us to adopting Thanos.
- Then we discovered we were still investing lots of time and personnel to run these technologies and manage infrastructure.
- Finally we adopted Google Cloud Managed Service for Prometheus, which so far has met our needs quite well.
Open source Prometheus worked well when we had a smaller deployment
Commonly, organizations approach metrics using either a full service monitoring and metrics storage tool or an open source database to store their metrics, displaying them using a visualization tool like Grafana.
For the past five years, we used managed monitoring and storage services from two providers. Using different vendors created complexity for our operations teams and it made it hard for metrics to be shared with the teams who would eventually be responsible for maintaining reliability: the application teams! It is our belief that ownership of the metrics should reside with the application teams. It allows developers and product owners to maintain the metrics they deem essential for alerting and dashboarding.
After we made the switch to Prometheus, our experience was great—at first. Prometheus’ design allows each application to expose granular metrics which are gathered with a Prometheus collector and stored in a Prometheus database.
However, as we deployed it on an increasing number of GKE clusters used to run our production applications, we ran into some constraints. These included:
Support for scaled management
We’re moving our business towards an “infrastructure-as-code” model to deploy and manage resources because it is more efficient and results in fewer errors. We need a simple way to deploy Prometheus in each Kubernetes cluster by policy.
Retention
Prometheus’ default time series database retention is set to 15 days. The database retention is configurable, but it will increase your costs and resource consumption to keep your metrics on disk for longer periods. We need a better way to manage metrics retention for longer periods of time for all our Kubernetes clusters and applications.
Backup/Disaster recovery and restoration
Business continuity considerations are important for any service used in production. In Prometheus we found disk failures and backups to be a pain point. We need ways to scalably backup and restore data on Prometheus instances when failures occur to avoid data loss.
Operational scalability
Furthermore, Prometheus doesn’t offer a native sharding feature, which may be a strength from an administration or deployment point of view, but ends up being a weakness if you have multiple clusters to monitor.
Updates
Prometheus stores rules within a static file, which means you have to reboot your Prometheus instances in order to apply rules file updates.
Using Prometheus and Thanos to address some (but not all) needs
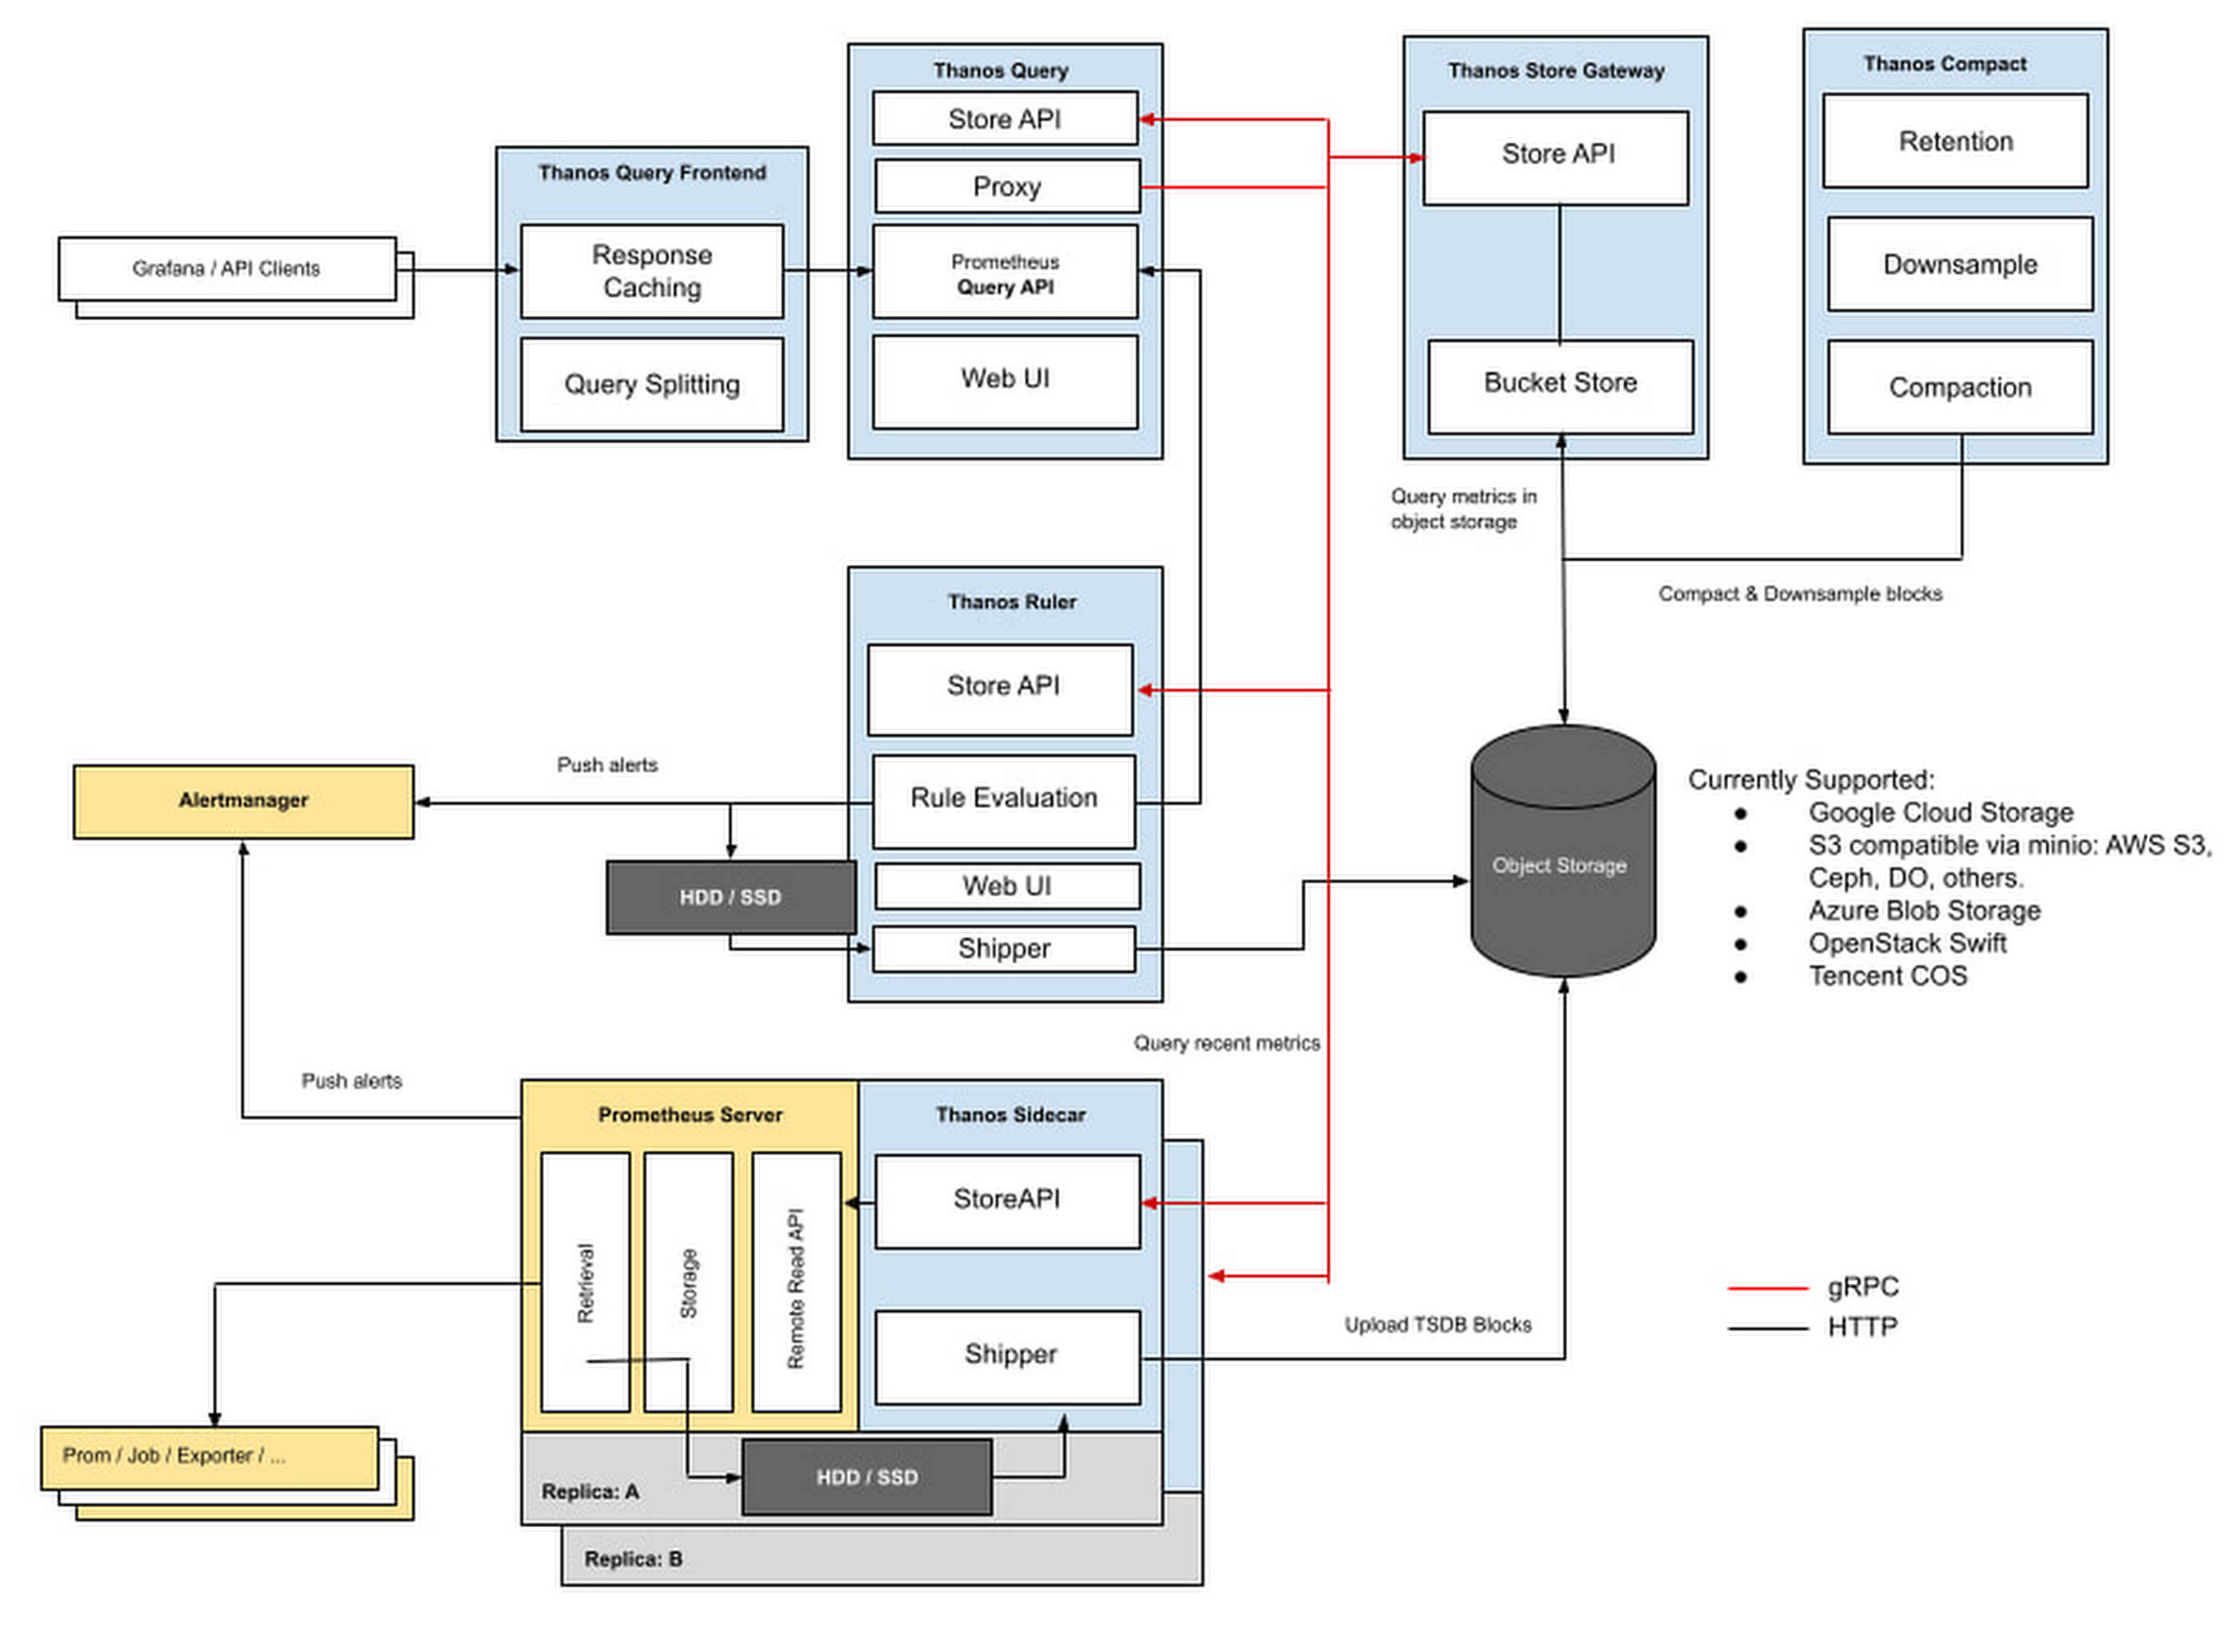
After we ran into the issues raised above, we searched for ways to address them and found Thanos. Thanos is an open-source project released in 2018 by Improbable. It helped us with multi-cluster management and data storage. Prometheus metrics can be sent to object storage services such as Google Cloud Storage, Azure Blob Storage, or AWS’ S3.
Like Prometheus, Thanos’ architecture is extensible by design:

Using Prometheus and Thanos together helped us solve the following issues, which we noted above:
Retention
Unlike Prometheus, Thanos is query-based instead of collection-based. Thanos sidecars are deployed alongside Prometheus instances and gather only metrics they are asked to expose. Thanos’ documentation describes each role. If Prometheus retention has been configured, and metrics aren’t available on the local disk, it will ask its Store Gateway component to retrieve the metrics from the remote storage location. With this feature, we can address the metric retention issue raised with standalone Prometheus. Additionally, Thanos addresses some other common Prometheus needs:
Federation
Thanos allows us to set up a global view of our multi-cluster environments, whereas Prometheus could not. This requires us to set up one Querier per Kubernetes cluster and one Querier “federator,” which you can see in the diagram below.
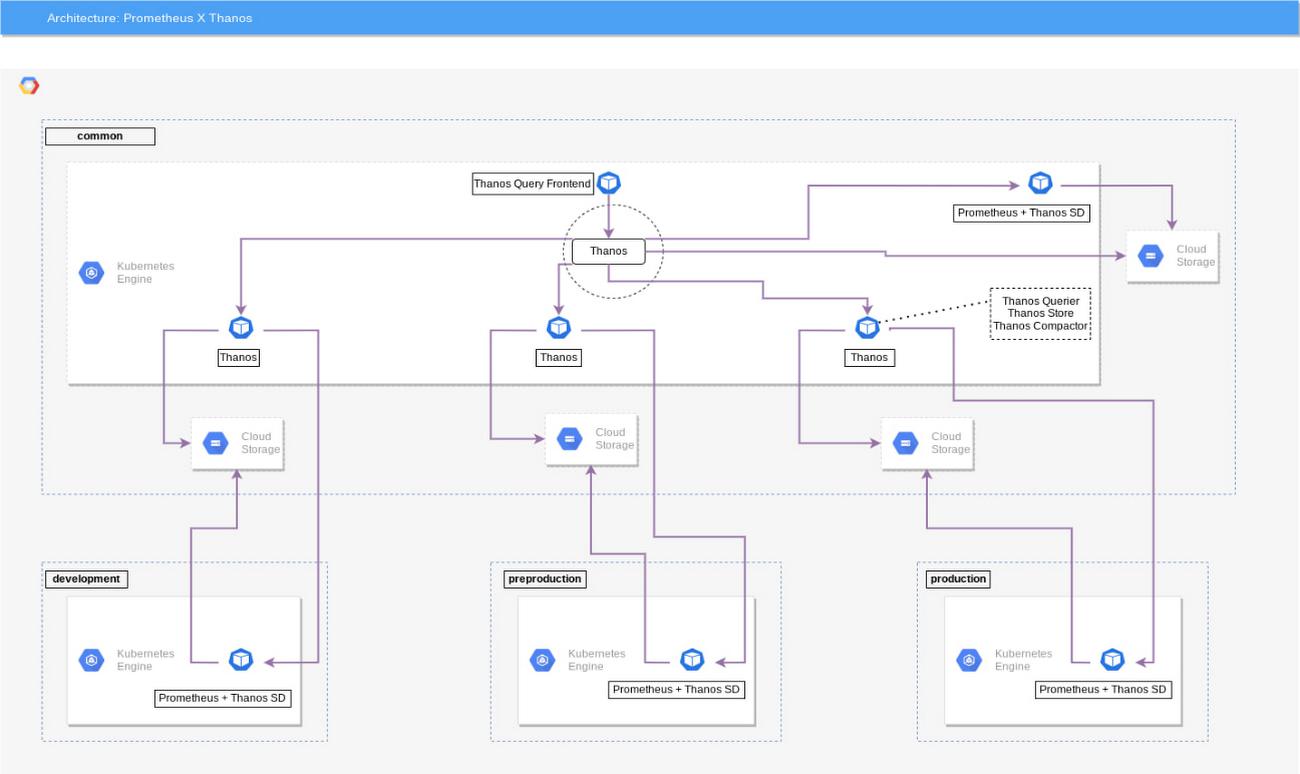
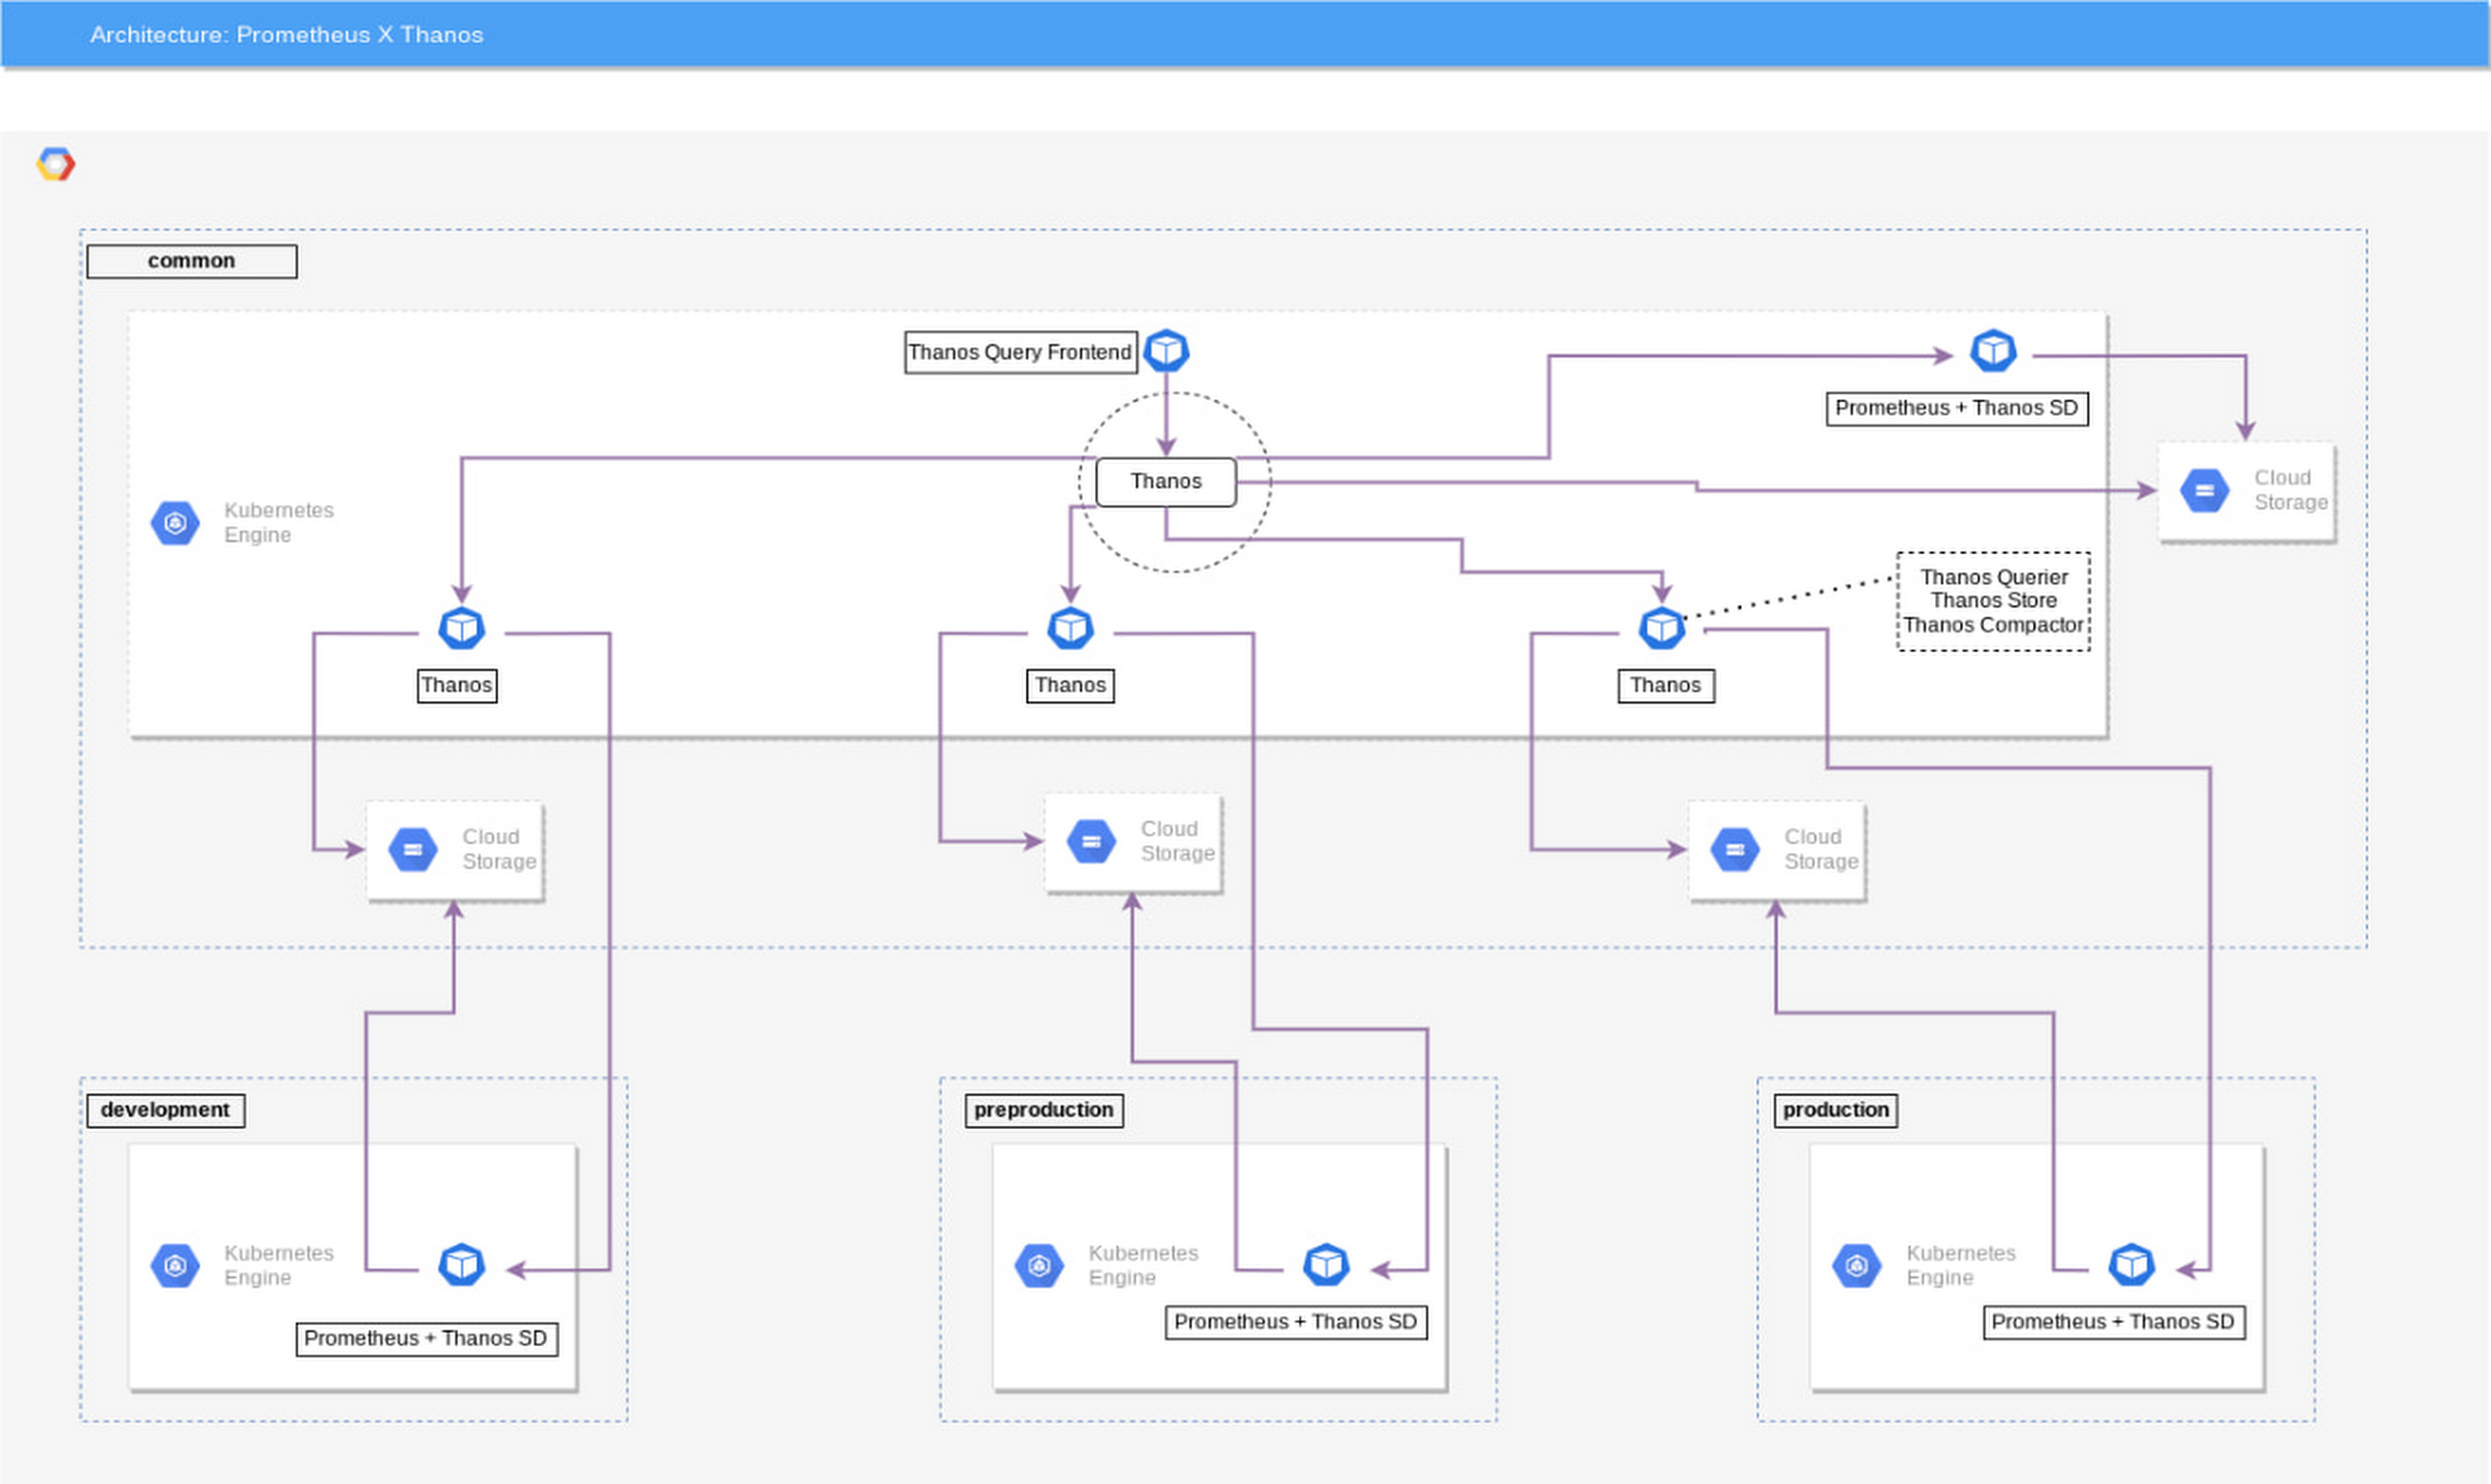
The Querier components can be added to our multi-cluster environments via the addition of a simple configuration (see example code below) to get a global view of our metrics.
apiVersion: apps/v1kind: Deploymentmetadata:name: thanos-queriernamespace: monitoringlabels:app: thanos-querierspec:replicas: 3selector:matchLabels:app: thanos-queriertemplate:metadata:labels:app: thanos-querierspec:containers:- name: thanosimage: quay.io/thanos/thanos:v0.23.1args:- query- --log.level=debug- --query.replica-label=replica- --store=dnssrv+thanos-store-gateway:10901ports:- name: httpcontainerPort: 10902- name: grpccontainerPort: 10901livenessProbe:httpGet:port: httppath: /-/healthyreadinessProbe:httpGet:port: httppath: /-/ready
Thanos querier deployment configuration example
Prometheus and Thanos works, but increased complexity
Thanos helped us a lot by dealing with issues raised by standalone Prometheus. However, it came with a lot of components which increased our complexity. This led to the following downsides for us:
Development time
The multi-cluster, global environment that we described above required engineering resources and time to set up and maintain. Our engineers’ time is very valuable, and we would rather spend it developing new features instead of maintaining a state-of-the-art metrics system.
Increased infrastructure load
Configuring each Kubernetes cluster with the Thanos Queriers to enable remote storage led to increased network bandwidth consumption. In addition, we had now more components added to Prometheus which meant more system consumption (CPU, RAM).
After going through the initial deployment of Prometheus and then trying to solve problems on our own with yet another solution (Thanos), we decided that it was time to look into a managed alternative.
Switching to a managed service: Google Cloud Managed Service for Prometheus
In October of 2021, Google Cloud released the public preview of Managed Service for Prometheus, which we understood to be a drop-in replacement for an existing Prometheus stack.
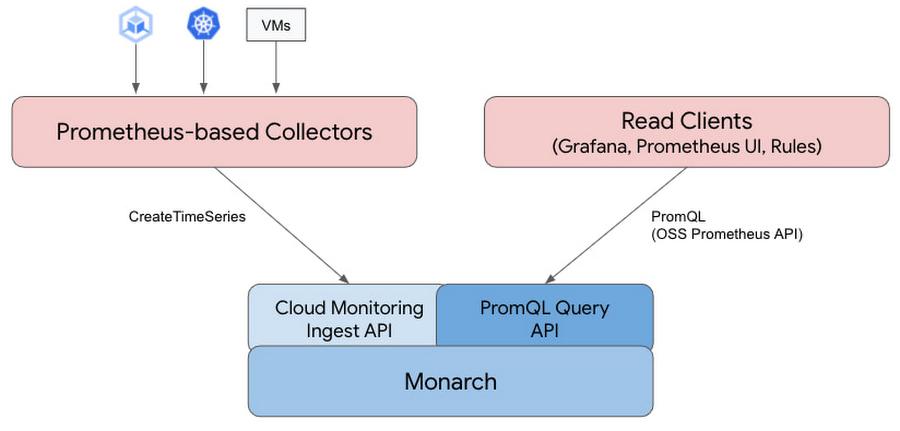

Metrics for the service are retrieved by collectors, which are a fork of the open source Prometheus technology. The collectors send metrics to Google’s global time-series database named Monarch, which removed the need for Thanos.
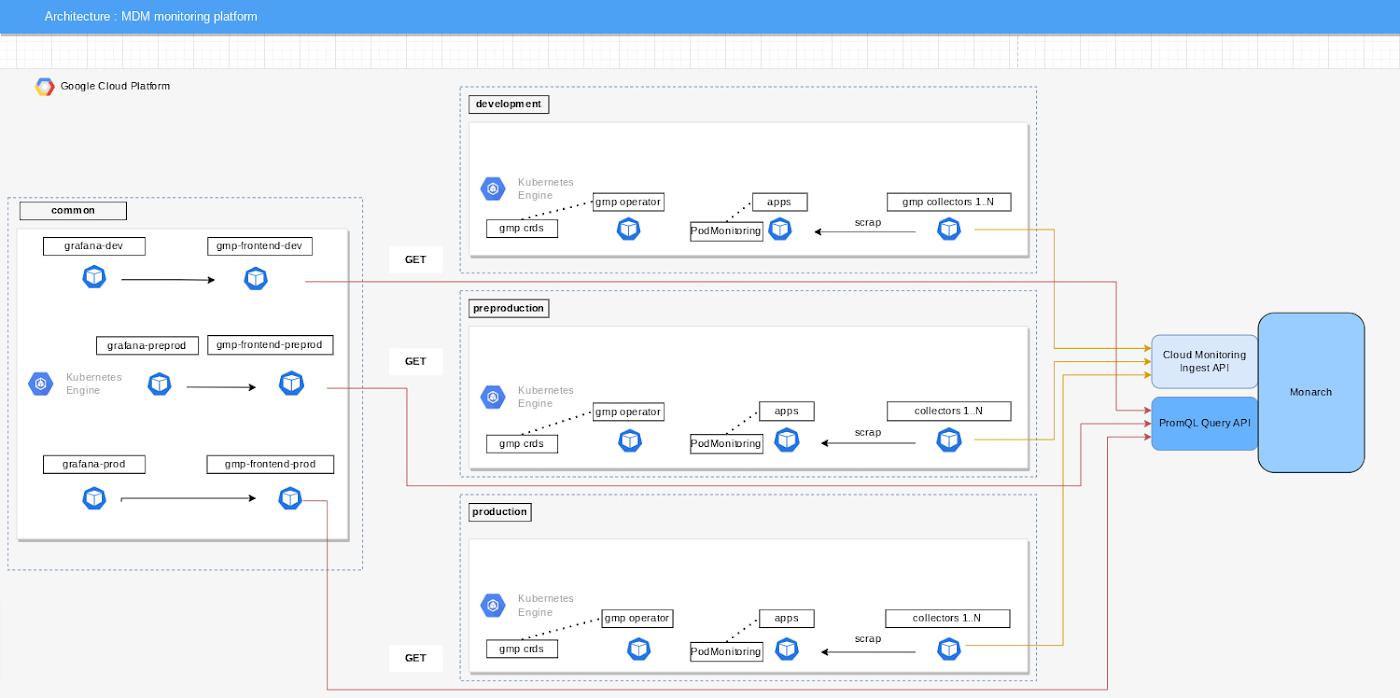
Google Cloud gave us two modes for using Managed Service for Prometheus. In our case we are using managed collection, which allows us to reduce the complexity of deploying and managing Prometheus instances. Managed Service for Prometheus provides an operator to configure Custom Resources (CRs) for scraping metrics, evaluating rules, and more. All our Prometheus operations are handled by the Kubernetes operator.
In addition, this solution supports more current Prometheus use cases (e.g. migrating from ServiceMonitor to PodMonitoring scrape configs).
Because we expect our metrics data to steadily grow alongside our company’s growth, we know that managing metrics at scale ourselves will likely become very painful. Google Cloud Managed Service for Prometheus helped us achieve scaled metrics infrastructure in a straightforward way, as a managed service, without devoting hundreds of servers to this effort. We want to focus our attention on building a functional and strategic metrics-based operations practice, instead of building a competency in managing long-term storage and Prometheus infrastructure.

Managed Service for Prometheus is not the perfect solution for us yet as it can be deployed using the Google Cloud Console, gcloud cli, or the kubectl tool. We hear that Terraform support is in the works. We needed to add additional engineering resources to deploy it using Helm charts. We invested in building Helm charts to help automate some of our processes and are happy to share this code with you to make your journey easier. Please visit the Medium blog we wrote on this topic to see our code snippets.
Get started on your journey
To sum it all up, while the structure, capabilities, and ecosystem of Prometheus are a good fit for our business, running the infrastructure and software was not worth it for us at scale. That’s why we chose Managed Service for Prometheus. We use Google Cloud’s fully managed service to monitor and manage alert notifications for our workloads. It scales with our needs and does not require management or maintenance.
If you’re getting started soon with your own Managed Service for Prometheus deployment, we recommend you check out this video that walks you through the first steps or visit the Managed Service for Prometheus page for more information. You can also take the fast track and join our teams to work on our stack. Check out our website — we have a lot of open positions.
By: Victor Ladouceur (SRE, Maisons du Monde)
Source: Google Cloud Blog
For enquiries, product placements, sponsorships, and collaborations, connect with us at [email protected]. We'd love to hear from you!
Our humans need coffee too! Your support is highly appreciated, thank you!