Visualization is the key to understanding massive amounts of data. Today we have BigQuery and Looker to analyze petabytes scale data and to extract insights in a sophisticated way. But how about monitoring data that actively changes every second? In this post, we will walk through how to build a real-time dashboard with Cloud Run and Firestore.
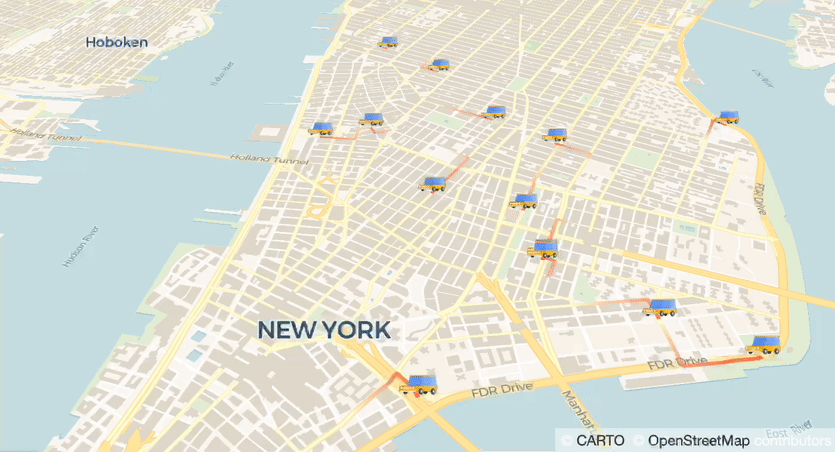
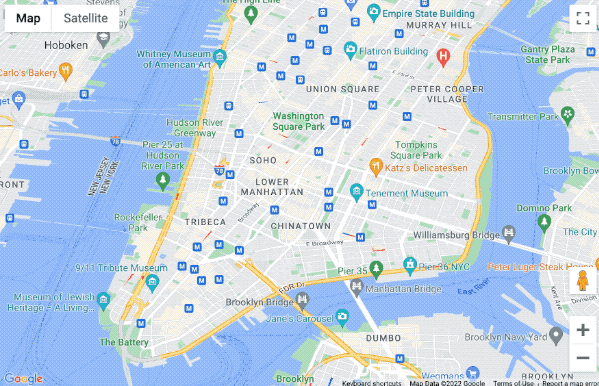
Mobility Dashboard
There are many business use cases that require real-time updates. For example, inventory monitoring in retail stores, security cameras, and MaaS (Mobility as a Service) applications such as share ride. In the MaaS business area, locations of vehicles are very useful in making business decisions. In this post, we are going to build a mobility dashboard, monitoring vehicles on a map in real-time.
From our partners:
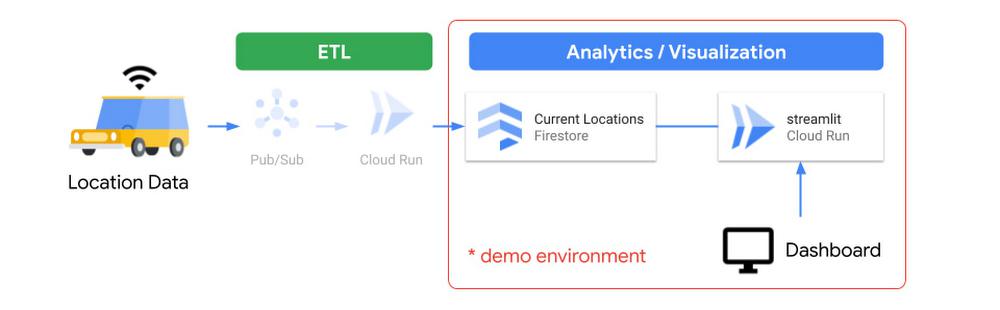
The Architecture
The dashboard should be accessible from the web browser without any setups on the client side. Cloud Run is a good fit because it can generate URLs, and of course, scalable that can handle millions of users. Now we need to implement an app that can plot geospatial data, and a database that can broadcast its update. Here are my choices and architecture.
- Cloud Run — Hosting a web app (dashboard)
- (streamlit — a library to visualize data and to make web app)
- (pydeck — a library to plot geospatial data)
- Firestore — a full managed database that keeps your data in sync
The diagram below illustrates a brief architecture of the system. In the production environment, you may also need to implement a data ingestion and transform pipeline.

Before going to the final form, let’s take some steps to understand each component.
Step 1: Build a data visualization web app with Cloud Run + streamlit
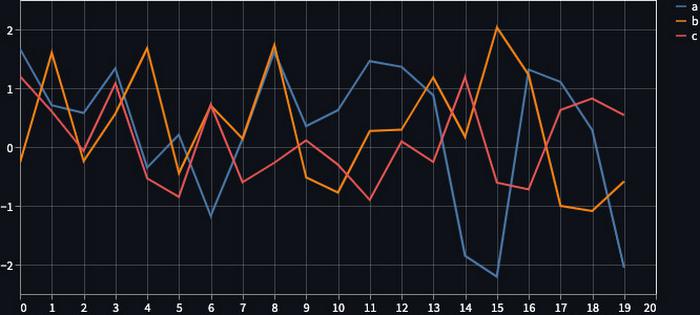
streamlit is an OSS web app framework that can create beautiful data visualization apps without knowledge of the front-end (e.g. HTML, JS). If you are familiar with pandas DataFrame for your data analytics, it won’t take time to implement. For example, you can easily visualize your DataFrame in a few lines of code.
import streamlit as stchart_data = pd.DataFrame(np.random.randn(20, 3),columns=['a', 'b', 'c'])st.line_chart(chart_data)

Making this app runnable on Cloud Run is easy. Just add streamlit in requirements.txt, and make Dockerfile from a typical python webapp image. If you are not familiar with Docker, buildpacks can do the job. Instead of making Dockerfile, make Procfile with just 1 line as below.
web: streamlit run app.py --server.port $PORT --server.enableCORS=false
To summarize, the minimum required files are only as below.
.|-- app.py|-- Procfile|-- requirements.txt
Deployment is also easy. You can deploy this app to Cloud Run with just a command.
$ gcloud run deploy mydashboard --source .
This command will build and make your image with buildpacks and Cloud Build, thus you don’t need to set up a build environment in your local system. Once deployment is completed, you can access your web app with the generated URL like https://xxx-[…].run.app. Copy and paste the URL into your web browser, and you will see your first dashboard webapp.
Step 2: Add a callback function that receive changes in Firestore database
In the STEP 1, you can visualize your data with fixed conditions or interactively with UI functions on streamlit. Now we want it to update by itself.
Firestore is a scalable NoSQL database, and it keeps your data in sync across client apps through real-time listeners. Firestore is available on Android and iOS, and also provides SDKs in major programming languages. Since we use streamlit in Python, let us use a Python client.
In this post we don’t cover detailed usage of Firestore though, it is easy to implement a callback function that is called when a specific “Collection” has been changed. [reference]
from google.cloud import firestore_v1db = firestore_v1.Client()collection_ref = db.collection(u'users')def on_snapshot(collection_snapshot, changes, read_time):for doc in collection_snapshot.documents:print(u'{} => {}'.format(doc.id, doc.to_dict()))# Watch this collectioncollection_watch = collection_ref.on_snapshot(on_snapshot)
In this code, on_snapshot callback function is called when users Collection has been changed. You can also watch changes of Document.
Since Firestore is a fully managed database, you would not need to provision the service ahead. You only need to choose “mode” and location. To use real-time sync functionality, select “Native mode”. Also select nearest or desired location.
Using Firestore with streamlit
Now let’s implement Firestore with streamlit. We add on_snapshot callback and update a chart with the latest data sent from Firestore. Here is one quick note when you use the callback function with streamlit. on_snapshot function is executed in a sub thread, instead UI manipulation in streamlit must be executed in a main thread. Therefore, we use Queue to sync the data between threads. The code will be something like below.
from queue import Queueq = Queue()def on_snapshot(collection_snapshot, changes, read_time):for doc in collection_snapshot.documents:q.put(doc.to_dict()) # Put data into the Queue# below will run in main threadsnap = st.empty() # placeholderwhile True:# q.get() is a blocking function. thus recommend to add timeoutdoc = q.get() # Read from the Queuesnap.write(doc) # Change the UI
Deploy this app and write something in the collection you refer to. You will see the updated data on your webapp.
Step 3: Plot a geospatial data with streamlit
We learned how to host web apps on Cloud Run, then how to update data with Firestore. Now we want to know how to plot geospatial data with streamlit. streamlit has multiple ways to plot geospatial data which includes latitude and longitude, we here used pydeck_plot(). This function is a wrapper of deck.gl, a geospatial visualization library.
For example, provide data in latitude and longitude as to plot, add layers to visualize them.
import streamlit as stimport pydeck as pdkimport pandas as pdimport numpy as npdf = pd.DataFrame(np.random.randn(1000, 2) / [50, 50] + [37.76, -122.4],columns=['lat', 'lon'])st.pydeck_chart(pdk.Deck(map_provider="carto",map_style='road',initial_view_state=pdk.ViewState(latitude=37.76,longitude=-122.4,zoom=11,pitch=50,),layers=[pdk.Layer('HexagonLayer',data=df,get_position='[lon, lat]',radius=200,elevation_scale=4,elevation_range=[0, 1000],pickable=True,extruded=True,),pdk.Layer('ScatterplotLayer',data=df,get_position='[lon, lat]',get_color='[200, 30, 0, 160]',get_radius=200,),],))
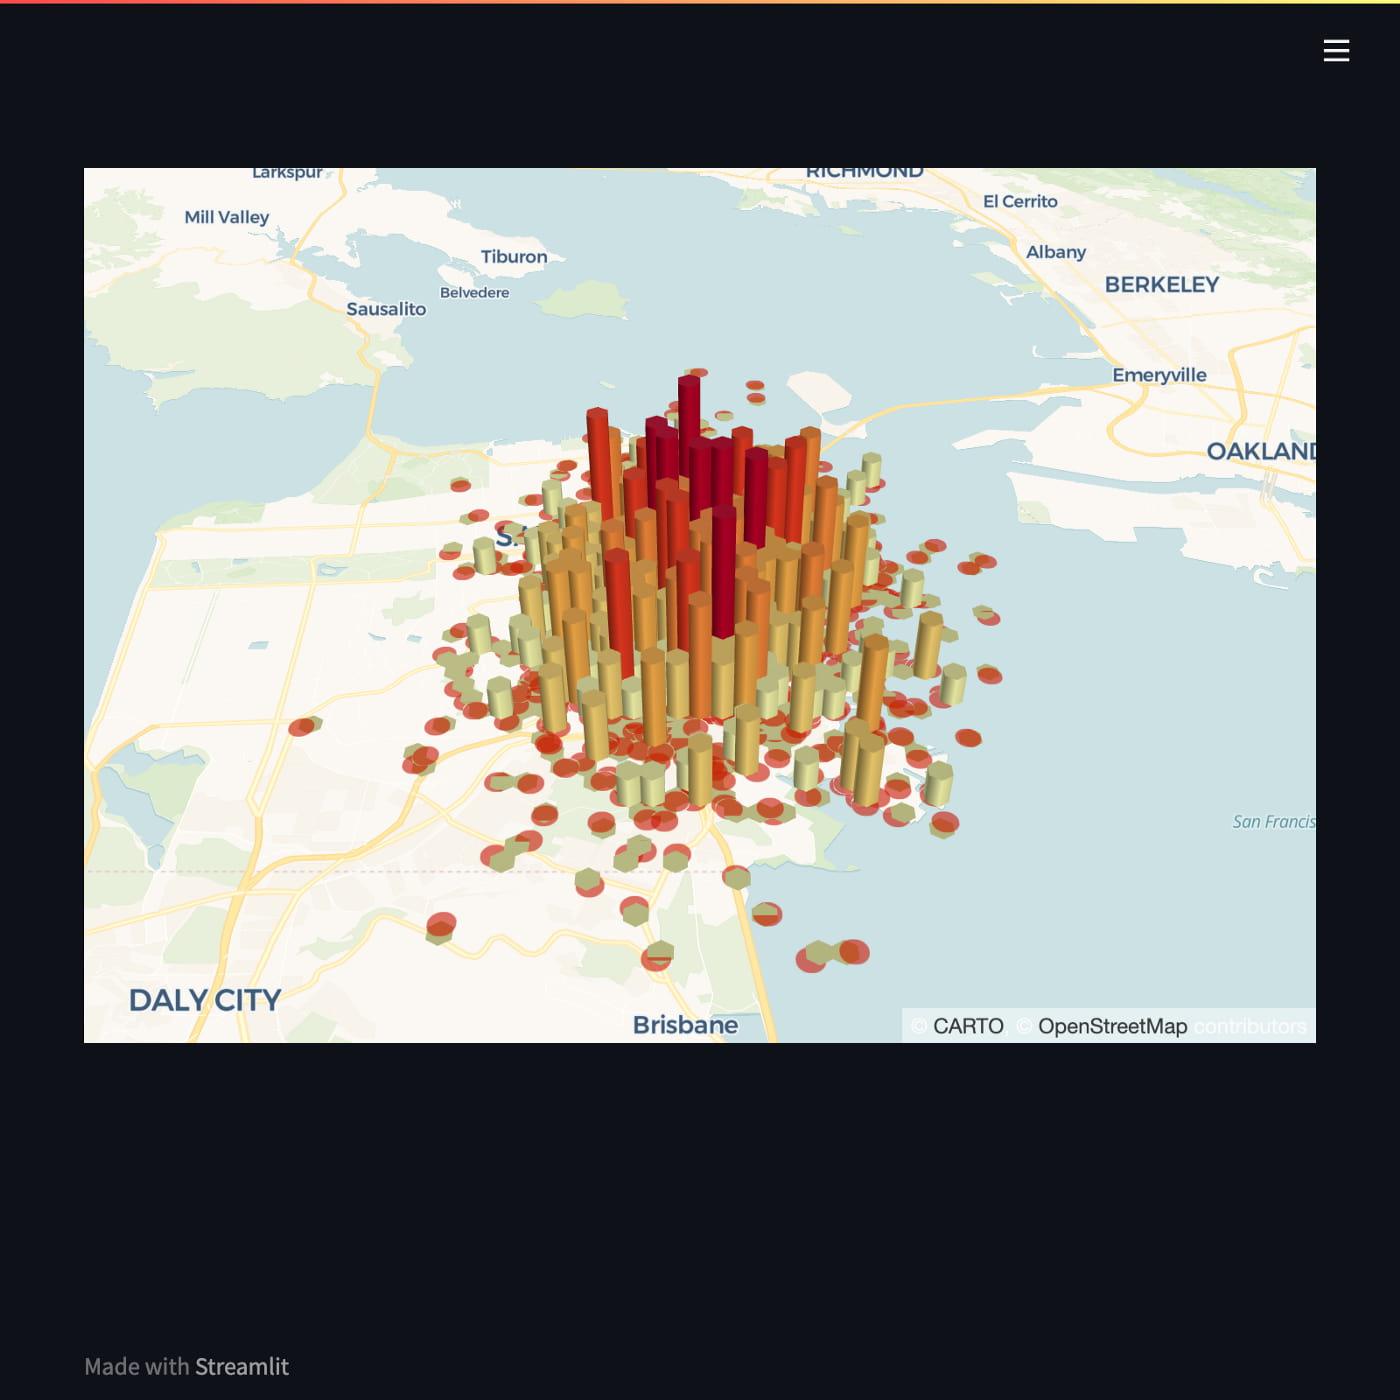

pydeck supports multiple map platforms. We here chose CARTO. If you would like to know more about great examples using CARTO and deck.gl, please refer to this blog.
Step 4: Plot mobility data
We are very close to the goal. Now we want to plot locations of vehicles. pydeck supports some ways to plot data, and TripsLayer would be a good fit to plot mobility data.
TripsLayer can visualize location data in time sequential. That means, when selecting a specific timestamp, it plots lines from location data in the time including last n periods. It also draws like an animation when you change the time in sequential order.
In the final form, we also add IconLayer to identify the latest location. This layer is also useful when you want to plot a static location, and it just works like a “pin” on Google Maps.
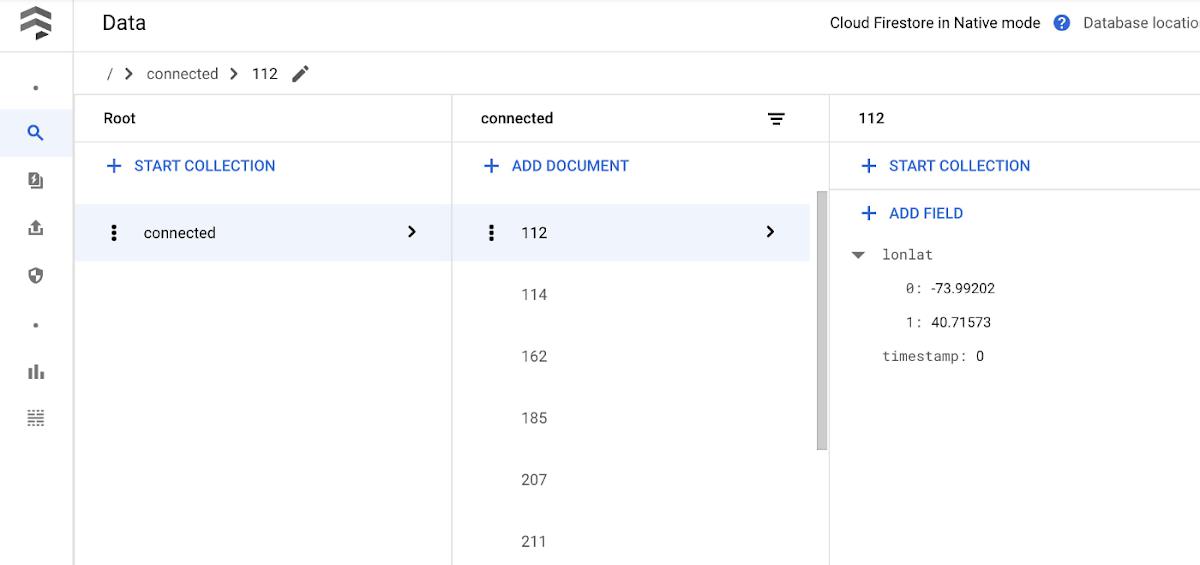
Now we need to think about how to use this plot with Firestore. Let’s make Document per vehicle, and only save the latest latitude, longitude, and timestamp of every vehicle. Why not save the history of locations? In that case, we should rather use BigQuery. We just want to see the latest locations that update in realtime.
Firestore is useful and scalable, yet NoSQL. Note that there are some good fits and bad fits in NoSQL.
Step 5: Run
Finally, we are here. Now let’s ride in a car and record data… if possible.
For demo purposes, now we ingest dummy data into Firestore. It is easy to write data by using a client library.
db = firestore.Client()col_ref = db.collection('connected')col_ref.document(str(vehicle_ind)).set({'lonlat': [-74, 40.72],'timestamp': 0})
With writing dummy data, open the web page hosted on Cloud Run. you will see the map is updated upon new data coming.
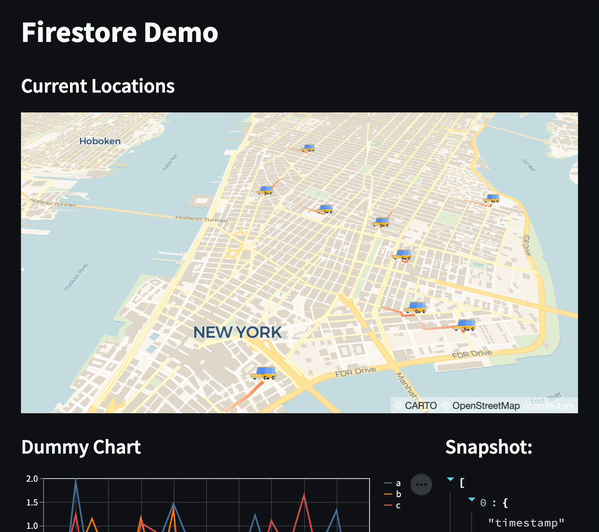
Note that we used dummy data and manipulated the timestamps. Consequently, the location data updates much faster than actual time. This can be fixed once you use proper data and update cycle.
Try it with your data
In this post, we learned how to build a dashboard updated in real-time with Cloud Run and Firestore. Let us know when you find other use-cases with those nice Google Cloud products.
- Find out more automotive solutions here.
- Haven’t used Google Cloud yet? Try it from here.
- Check out the source code on GitHub.
By: Hayato Yoshikawa (Customer Engineer, Automotive)
Source: Google Cloud Blog
For enquiries, product placements, sponsorships, and collaborations, connect with us at [email protected]. We'd love to hear from you!
Our humans need coffee too! Your support is highly appreciated, thank you!