
Displaying data through maps enables you to communicate key information to your users in a more visually engaging and intuitive way. One way to do this is through utilizing polygons to highlight regions and data. Many of you have told us that purchasing, updating, and maintaining your own boundary data to style polygons and create choropleth maps is expensive and takes a lot of development time and resources. One of the most commonly requested features you have asked for is access to the same boundaries and polygons used in Google Maps to build informative and engaging maps for your customers. Today, we are excited to announce the preview release of Data-driven styling for the Maps JavaScript API, which enables you to display and style Google boundaries.
What is Data-driven styling?
From our partners:
Data-driven styling is a new capability that enables you to style your maps to visually convey key information to your users, using your proprietary data (e.g. store inventory) or publicly available data (e.g. election results).
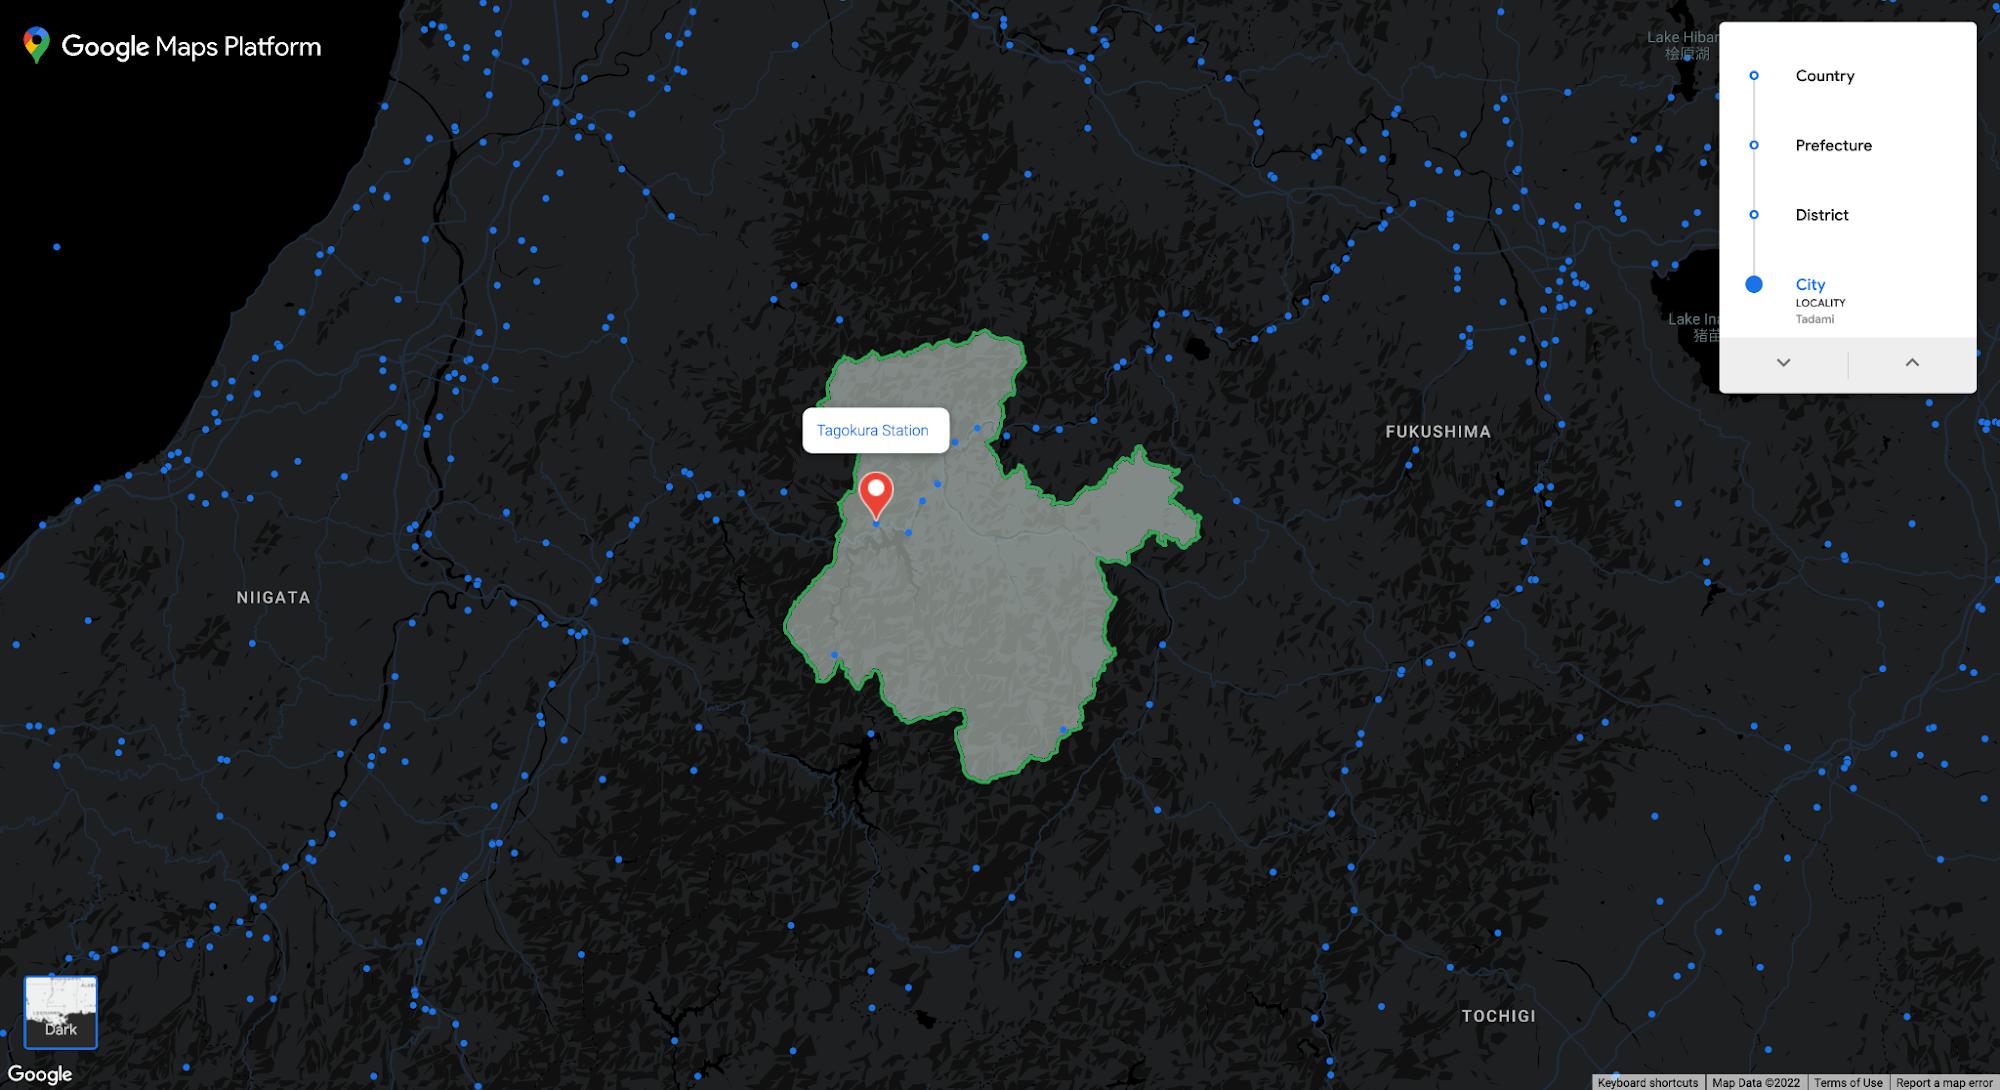
The first capability we are enabling with Data-driven styling is the ability for you to easily display Google’s polygons for administrative boundaries, or enhance your own tabular business data with Google’s administrative boundaries to style polygons or create rich, customized choropleth maps. This opens up possibilities for new visually engaging user experiences, and provides additional context to users on areas they care about, helping them make more informed decisions and save time.
Data-driven styling provides the same polygons for boundaries you see on Google Maps. Access country boundaries around the world, and for select countries we provide access to additional administrative boundary types such as localities, postal codes, and more. And Google manages the administrative boundary data for you, removing the need for you to purchase, update, and maintain boundary data yourself.
The ability to highlight geographical boundaries on a map was a long-awaited feature from our customers. It enables many new use cases where you previously had to worry about challenging technical aspects and costly data acquisition. Google Maps Platform is a source that provides high-quality polygons.

Key use cases
Data-driven styling enables a wide range of use cases that utilize boundary data across various industries, including real estate, travel, media, government, education, and many more. You can define the style and display the polygon for a specific administrative boundary that you choose. Visit our demo to explore these use cases.
To help a user easily visualize if a listing is in a desired area, you can provide context for a home, hotel or store search by displaying the polygon for the locality or postal code that they searched.
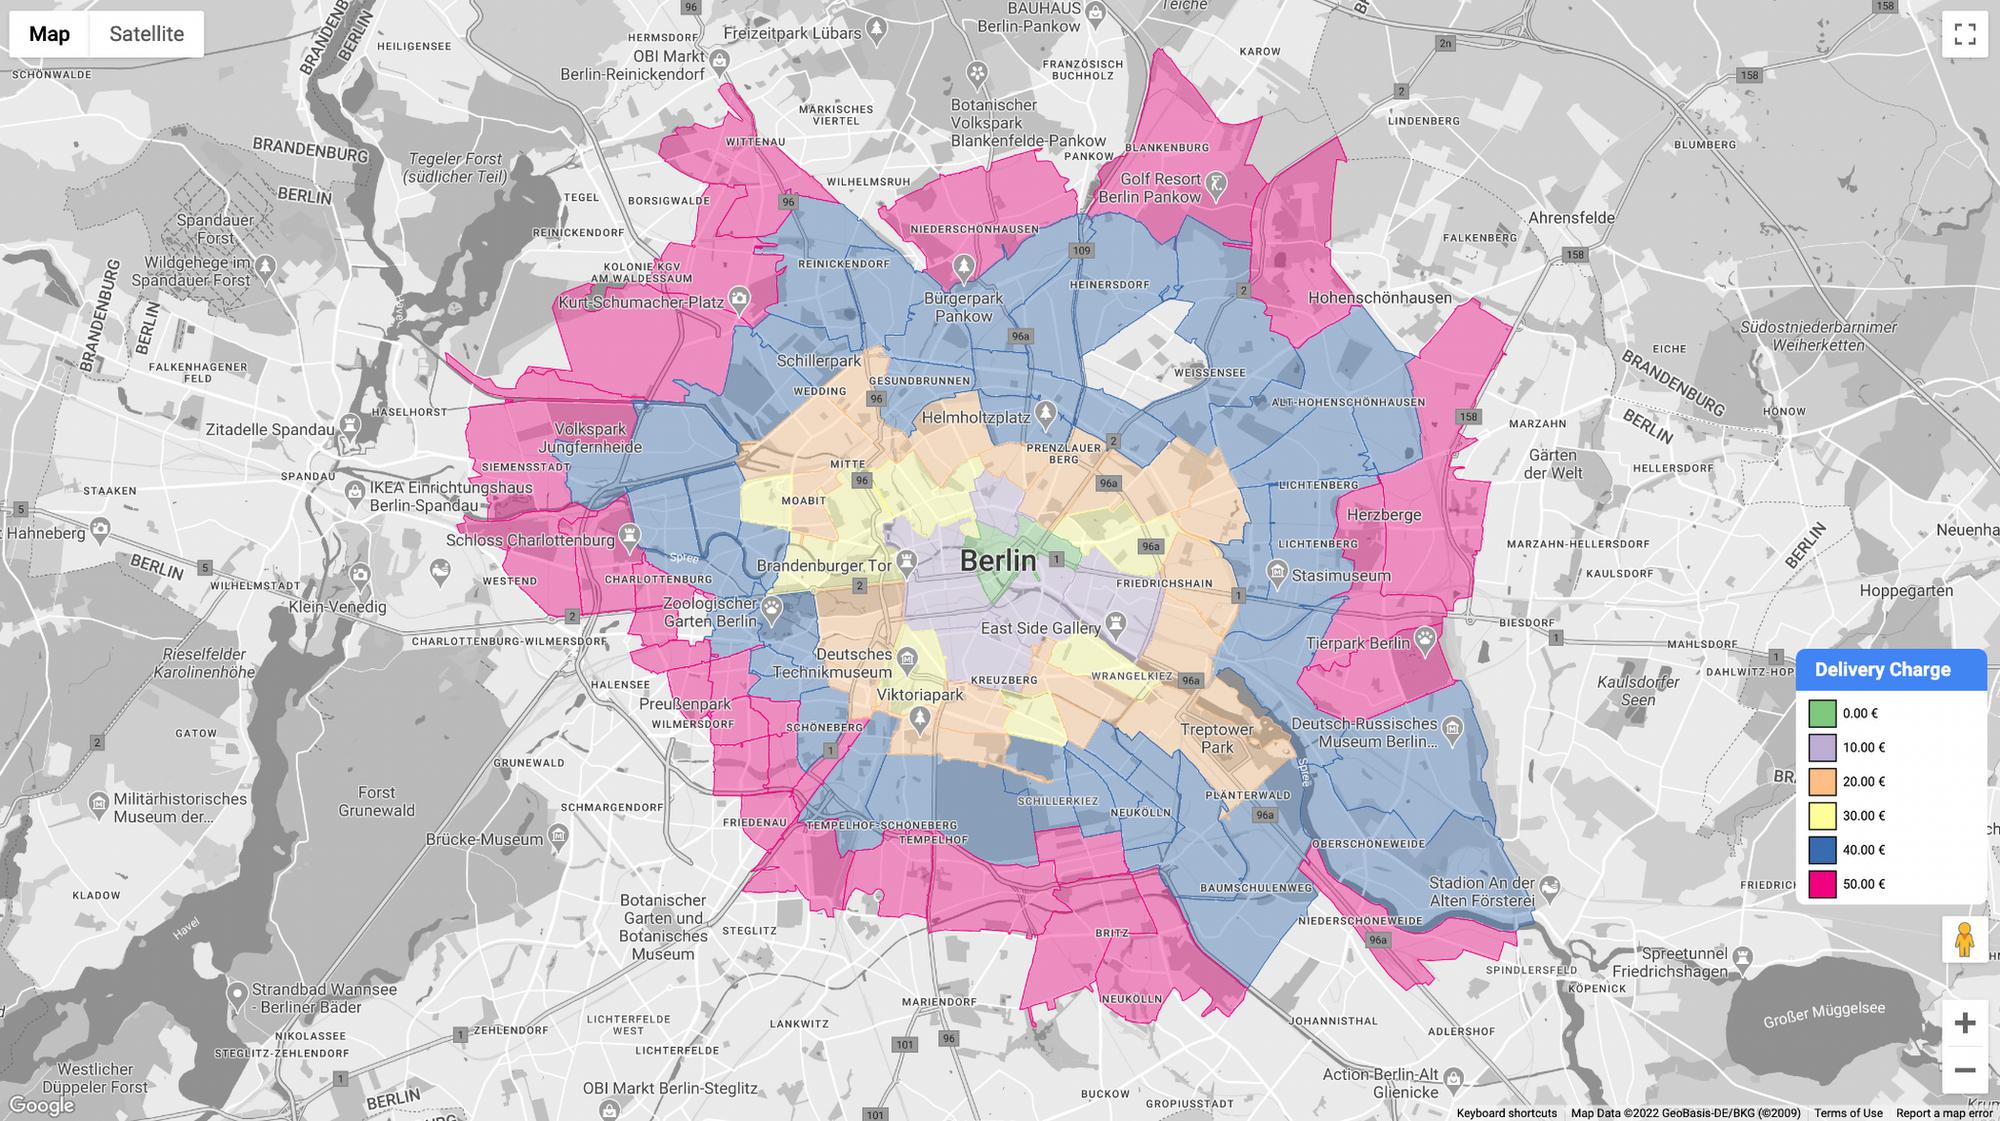
It also enables you to create a choropleth map for an administrative boundary type, using Google’s boundary data and your own or sourced tabular business data. For example, style multiple country, administrative area level 1, locality, or postal code boundaries by Covid-19 cases, home prices, or election results.
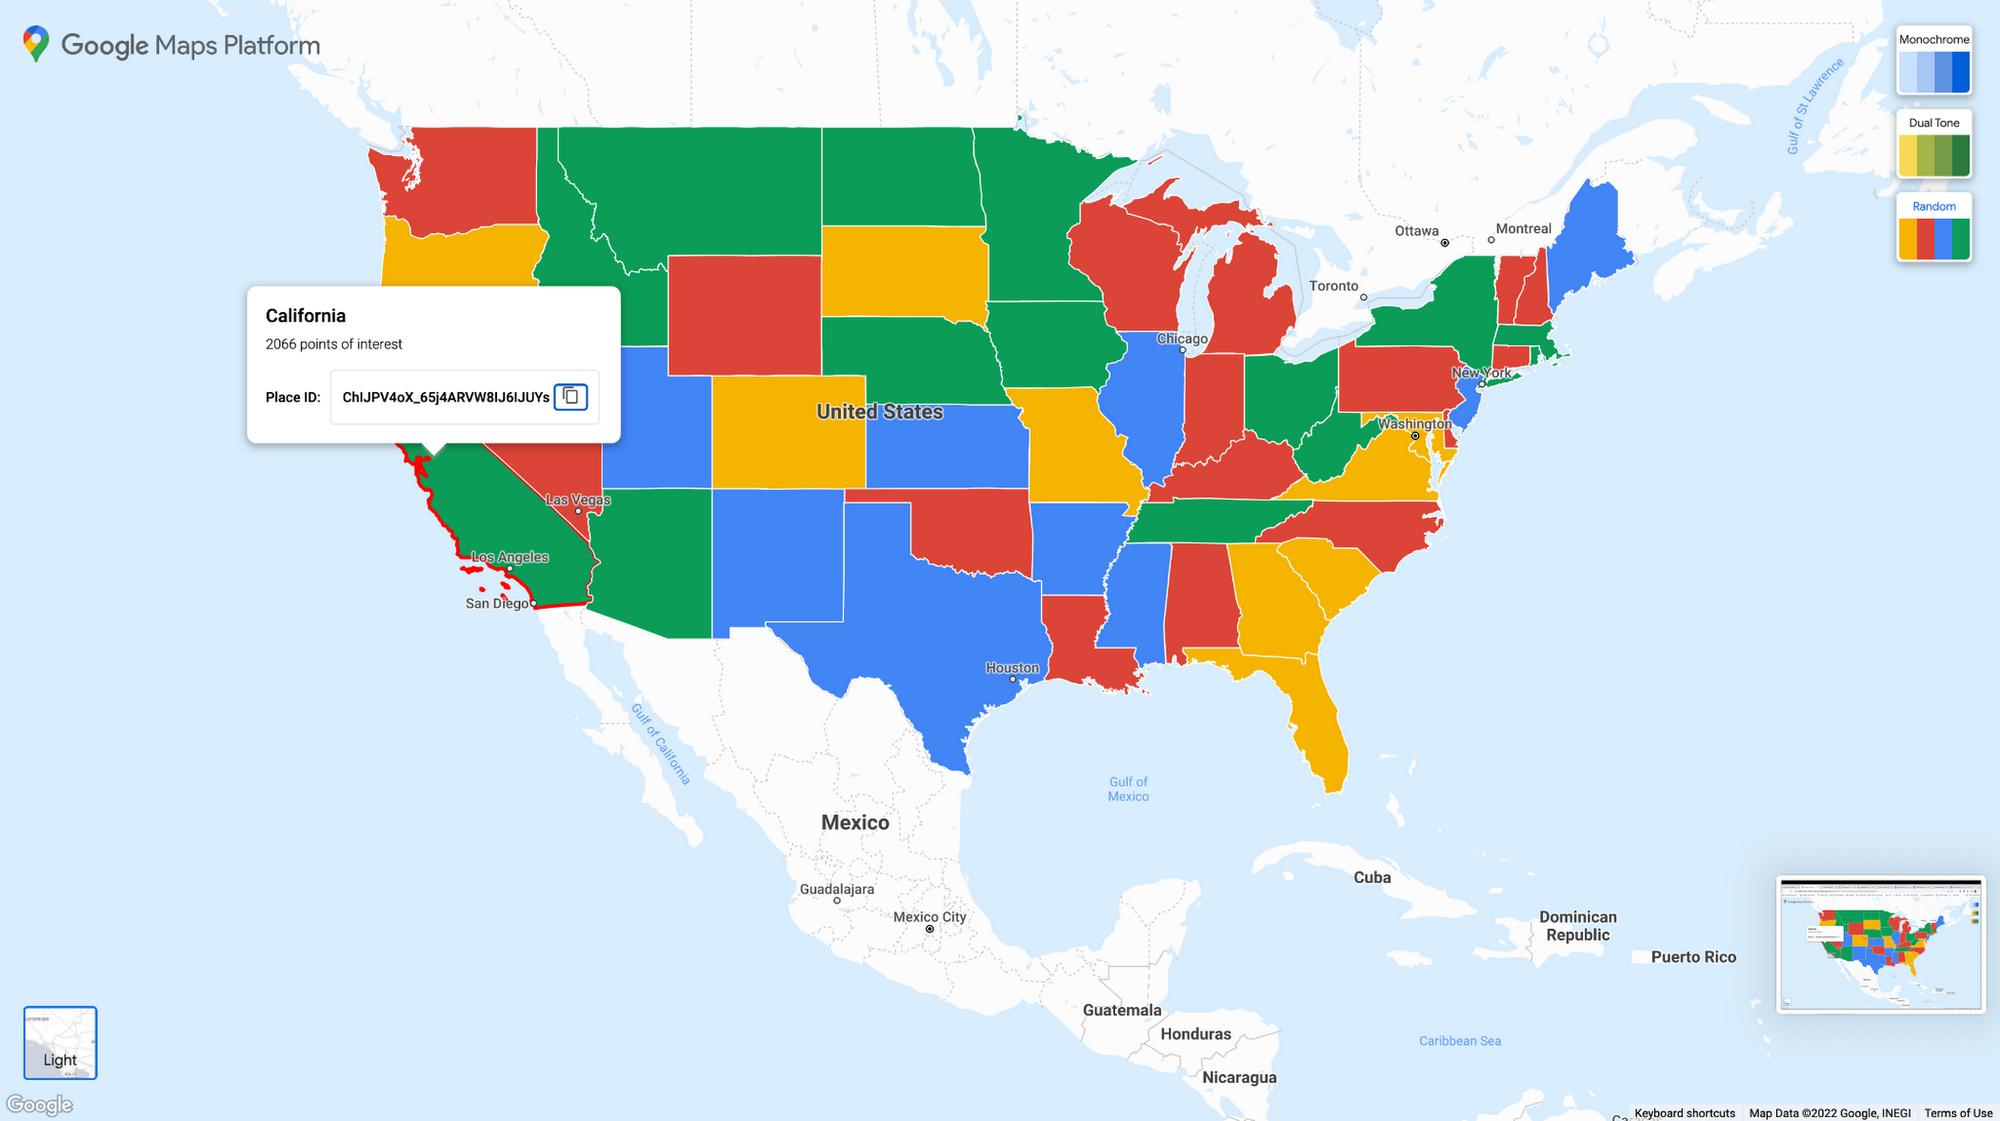
Data-driven styling also provides support for interactive user experiences. Clicking a polygon on your map returns metadata to your apps, including Place ID, feature type, and display name of the clicked polygon. These events are useful for experiences where you wish to restyle the map based on user interactions.
Using Data-driven styling
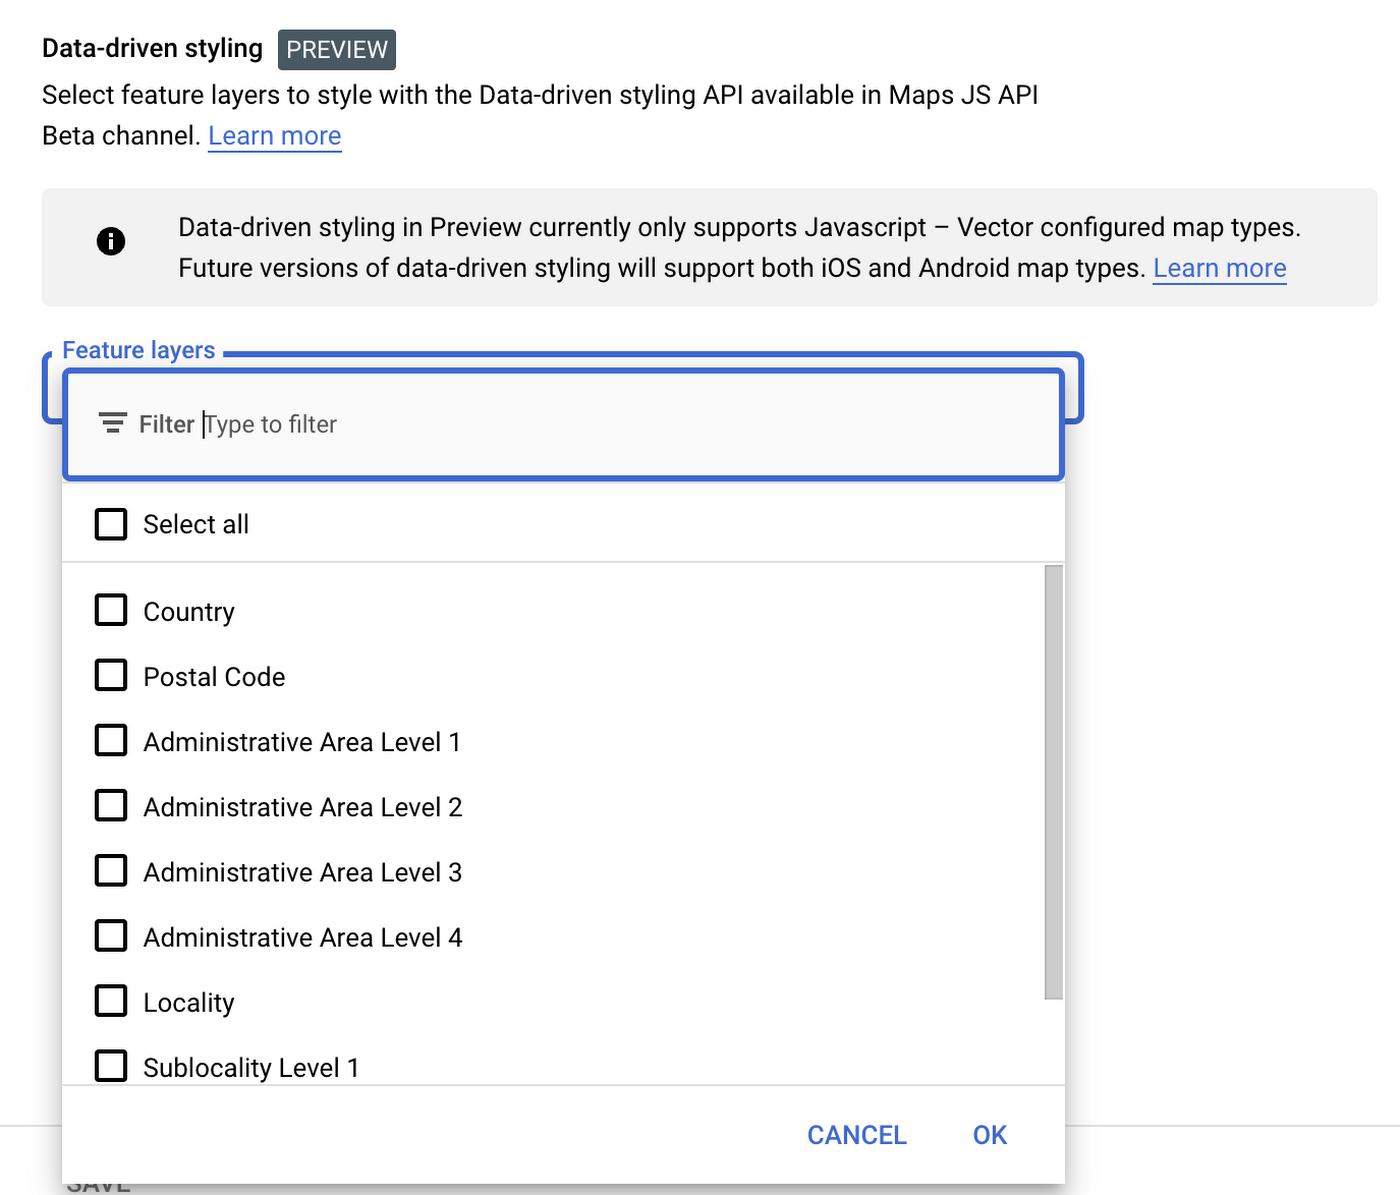
To enable Data-driven styling, select the feature layers you want to enable for a new or existing Map Style in the Google Cloud Console, and associate that style with a Map ID that has the vector map for JavaScript enabled. Please note that Data-driven styling is not supported for Static Maps or the raster tile map in JavaScript.
You’ll find the feature layers dropdown in the settings for your Map Styles over the coming days.
Then apply a FeatureStyleOptions object or FeatureStyleFunction to a feature layer in your code. You can customize fill and stroke color, fill and stroke opacity, and stroke weight for each feature layer.
At AppGeo, we have been building applications on Google Maps Platform for many years and the Data-driven styling feature is just another example of how Google continues to make it easier for mapping novices and experts alike to bring their spatial insights to light. Data-driven styling provides much easier access to the most commonly desired geographies for aggregating and visualizing data. We can now bring client data to life faster with less supporting data infrastructure and would be happy to help anyone interested in learning how to leverage these new assets.

Coverage
For the preview release, Data-driven styling provides access to feature types for administrative areas including countries, localities, postal codes and much more.
Visit our coverage table in the documentation to view supported countries and available feature types. We will continue to roll out additional coverage throughout the preview phase. If there are specific countries and feature types you’d like added, please provide your feedback through our Issue Tracker.
Styling polygons using Place ID
A common use case for Data-driven styling is to style individual polygons or a subset of polygons within a feature type, such as a limited set of countries or localities. The best way to do this is by referencing those boundaries using their Place IDs, which we allow you to cache indefinitely.
To make prefetching of Place IDs for individual regions easier, we are providing a region lookup utility that gives you the option to provide geographic coordinates, address, place name, ISO Code or FIPS code and returns the Place ID of the region available at that location. This utility is an open source library for JavaScript available on our Google Maps repository on GitHub. Alternatively, you can use Geocoding, Place Search, or Autocomplete to retrieve Place IDs for regions.
How to get started
Data-driven styling is included with Dynamic Maps for Maps Javascript API. Developers can use Data-driven styling and other Cloud-based maps styling features for Dynamic Maps by creating a Javascript Vector Map configured MapID in Google Cloud Console. In the future, we plan to introduce additional capabilities that will extend Data-driven styling to help you build more customized visualization and interactive experiences for your users, and to leverage your unique data.
Data-driven styling will be available in Preview over the next week for the Maps JavaScript API – visit our documentation to give it a try and let us know what you think. Also check out our new Dynamic Maps webpage to learn more, try the demo, and learn about other Cloud-based maps styling use cases and capabilities. Our team is eager to see what new possibilities these features open up for styling your maps.
For more information on Google Maps Platform, visit our website.
By: Alicia Sullivan (Product Manager, Google Maps Platform)
Source: Google Cloud Blog
For enquiries, product placements, sponsorships, and collaborations, connect with us at [email protected]. We'd love to hear from you!
Our humans need coffee too! Your support is highly appreciated, thank you!