aster.cloud aster.cloud
  • /
  • Platforms
    • Public Cloud
    • On-Premise
    • Hybrid Cloud
    • Data
  • Architecture
    • Design
    • Solutions
    • Enterprise
  • Engineering
    • Automation
    • Software Engineering
    • Project Management
    • DevOps
  • Programming
    • Learning
  • Tools
  • About
  • /
  • Platforms
    • Public Cloud
    • On-Premise
    • Hybrid Cloud
    • Data
  • Architecture
    • Design
    • Solutions
    • Enterprise
  • Engineering
    • Automation
    • Software Engineering
    • Project Management
    • DevOps
  • Programming
    • Learning
  • Tools
  • About
aster.cloud aster.cloud
  • /
  • Platforms
    • Public Cloud
    • On-Premise
    • Hybrid Cloud
    • Data
  • Architecture
    • Design
    • Solutions
    • Enterprise
  • Engineering
    • Automation
    • Software Engineering
    • Project Management
    • DevOps
  • Programming
    • Learning
  • Tools
  • About
  • DevOps
  • Engineering

Cloud Monitoring Metrics, Now In Managed Service For Prometheus

  • aster.cloud
  • July 14, 2022
  • 3 minute read

According to a recent CNCF survey, 86% of the cloud native community reports that they use Prometheus for observability. As Prometheus becomes more of a standard, an increasing number of developers are becoming fluent in PromQL, Prometheus’ built-in query language. While it is a powerful, flexible, and expressive query language, PromQL is typically only able to query Prometheus time series data. Other sources of telemetry, such as metrics offered by your Cloud provider or metrics generated from logs, remain isolated in separate products and might require developers to learn new query tools in order to access them.

Introducing PromQL for Google Cloud Monitoring metrics

Prometheus metrics alone aren’t enough to get a single pane of glass view of your Cloud footprint. Cloud Monitoring provides over 1,000 free metrics that let you monitor and alert on your usage of Google Cloud services, including metrics for Compute Engine, Kubernetes Engine, Load Balancing, BigQuery, Cloud Storage, Pub/Sub, and more. We’re excited to announce that you can now query all Cloud Monitoring metrics using PromQL and Managed Service for Prometheus, including Google Cloud system metrics, Kubernetes metrics, log-based metrics, and custom metrics.


Partner with aster.cloud
for your next big idea.
Let us know here.


From our partners:

CITI.IO :: Business. Institutions. Society. Global Political Economy.
CYBERPOGO.COM :: For the Arts, Sciences, and Technology.
DADAHACKS.COM :: Parenting For The Rest Of Us.
ZEDISTA.COM :: Entertainment. Sports. Culture. Escape.
TAKUMAKU.COM :: For The Hearth And Home.
ASTER.CLOUD :: From The Cloud And Beyond.
LIWAIWAI.COM :: Intelligence, Inside and Outside.
GLOBALCLOUDPLATFORMS.COM :: For The World's Computing Needs.
FIREGULAMAN.COM :: For The Fire In The Belly Of The Coder.
ASTERCASTER.COM :: Supra Astra. Beyond The Stars.
BARTDAY.COM :: Prosperity For Everyone.


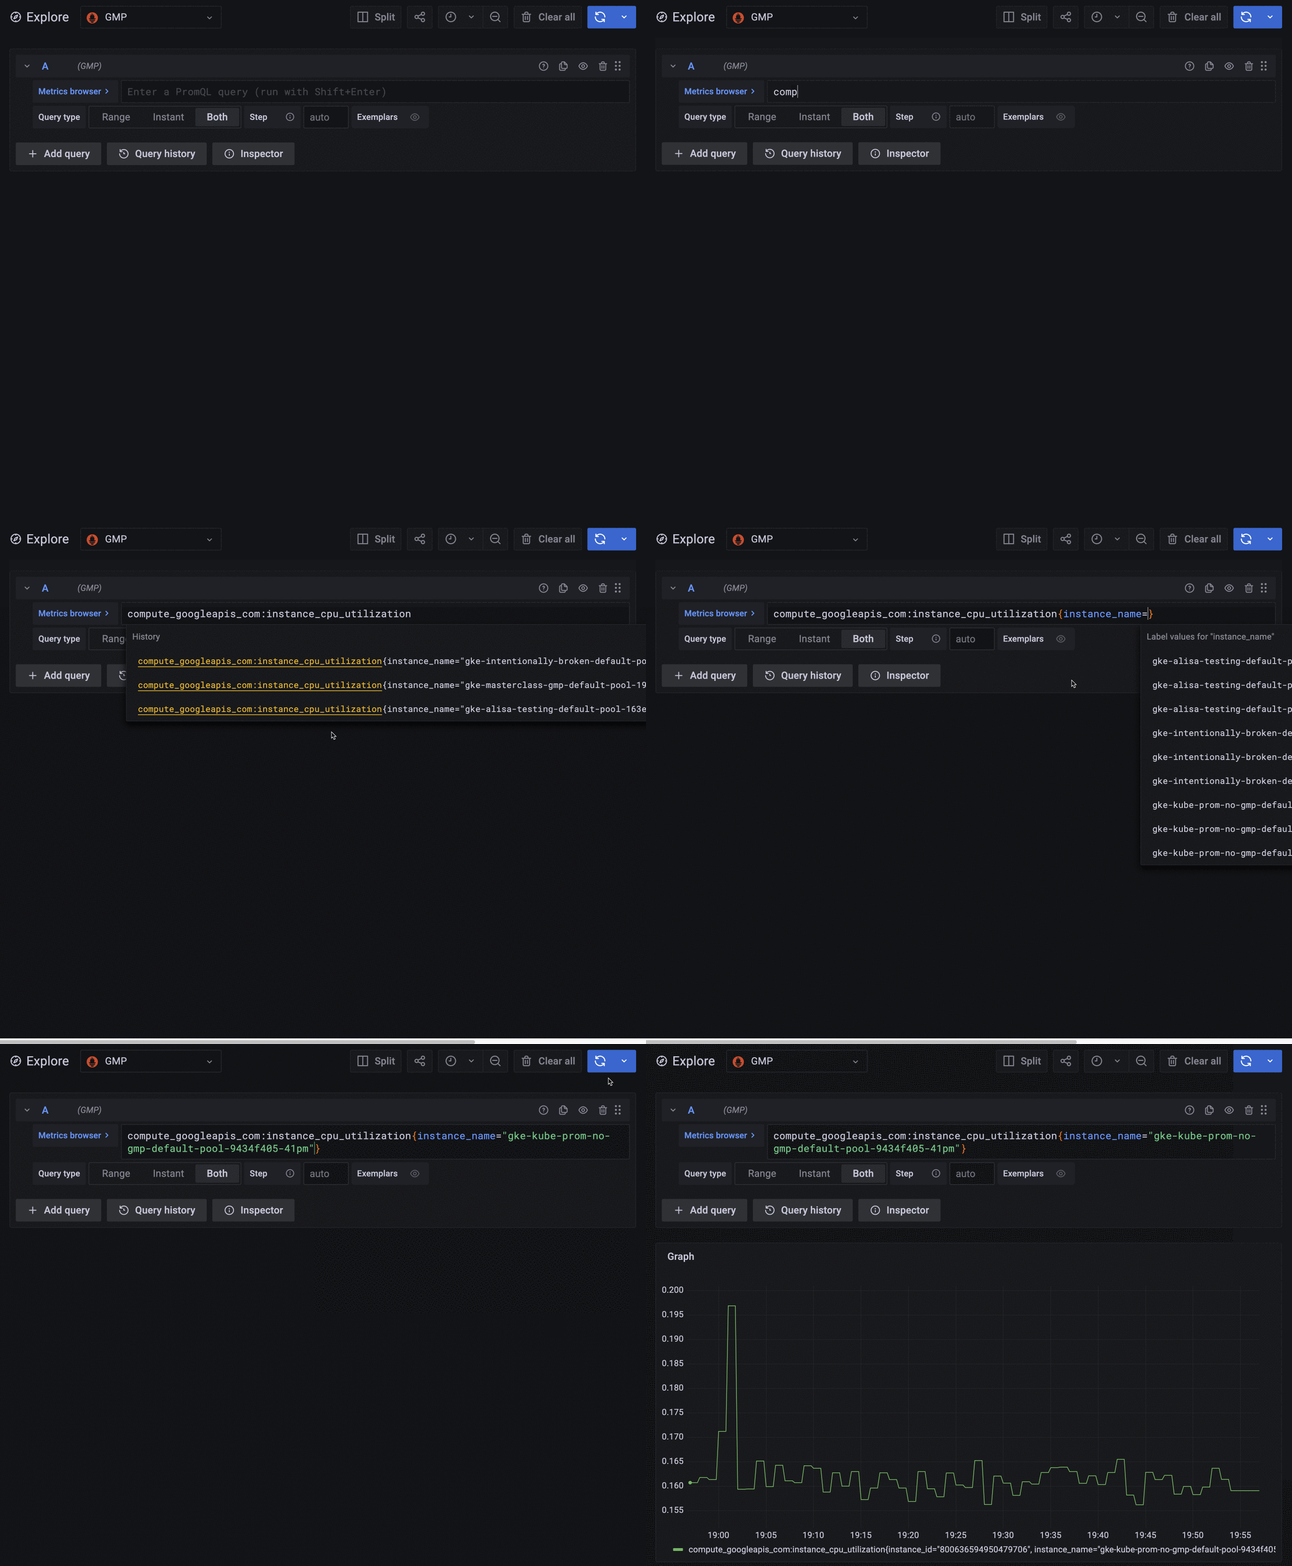
Google Cloud metrics appear within Grafana and can be queried using PromQL.


Because we built Managed Service for Prometheus on top of the same planet-scale time series database as Cloud Monitoring, all your metrics are stored together and are queryable together. Metrics in Cloud Monitoring are automatically generated when you use Google Cloud services at no additional cost to you. View all your metrics in one place with the query language that developers already know and prefer, opening up possibilities such as:

  • Correlating spikes in traffic with Redis cache misses using Cloud Load Balancing metrics and Prometheus’ Redis exporter
  • Graphing Cloud Logging’s logs-based metrics alongside Prometheus metrics
  • Alerting on your Compute Engine utilization or your Pub/Sub backlog size using PromQL and Managed Service for Prometheus’ rule evaluation
  • Substituting paid Istio metrics for their free Google Cloud Istio or Anthos Service Mesh equivalent
Read More  Cloud Wisdom Weekly: 3 Ways Serverless Can Save Money And Accelerate App Development

Exposing these metrics using PromQL means that developers who are familiar with Prometheus can start using all time series telemetry data without first having to learn a new query language. New members of your operations team can ramp up faster, as many industry hires will already be familiar with PromQL from previous experience.

Why Managed Service for Prometheus

In addition to PromQL for all metrics, Managed Service for Prometheus offers open-source monitoring combined with the scale and reliability of Google services. Additional benefits include:

  • Hybrid- and multi-cloud support, so you can centralize all your metrics across clouds and on-prem deployments
  • Two-year retention of all Prometheus metrics, included in the price
  • Cost-effective monitoring on a per-sample basis
  • Easy cost identification and attribution using Cloud Monitoring
  • Your choice of collection, with managed collection for those who want a completely hands-off Prometheus experience and self-deployed collection for those who want to keep using existing Prometheus configs

How to get started

You can query Cloud Monitoring metrics with PromQL by using the interactive query page in Cloud Console or Grafana. To learn how to write PromQL for Google Cloud metrics, see Mapping Cloud Monitoring metric names to PromQL. To configure a Grafana data source that can read all your metrics in Cloud Monitoring, see Configure a query user interface in the Managed Service for Prometheus documentation.

To query Prometheus data alongside Cloud Monitoring, you have to first get Prometheus data into the system. For instructions on configuring Managed Service for Prometheus ingestion, see Get started with managed collection.


Read More  Productivity Unlocked With New Cloud SDK Reference Docs


By: Lee Yanco (Product Manager)
Source: Google Cloud Blog


For enquiries, product placements, sponsorships, and collaborations, connect with us at [email protected]. We'd love to hear from you!

Our humans need coffee too! Your support is highly appreciated, thank you!

aster.cloud

Related Topics
  • Cloud Monitoring
  • Google Cloud
  • Managed Services
  • Prometheus
You May Also Like
View Post
  • Engineering

Just make it scale: An Aurora DSQL story

  • May 29, 2025
View Post
  • Engineering
  • Technology

Guide: Our top four AI Hypercomputer use cases, reference architectures and tutorials

  • March 9, 2025
View Post
  • Computing
  • Engineering

Why a decades old architecture decision is impeding the power of AI computing

  • February 19, 2025
View Post
  • Engineering
  • Software Engineering

This Month in Julia World

  • January 17, 2025
View Post
  • Engineering
  • Software Engineering

Google Summer of Code 2025 is here!

  • January 17, 2025
View Post
  • Data
  • Engineering

Hiding in Plain Site: Attackers Sneaking Malware into Images on Websites

  • January 16, 2025
View Post
  • Computing
  • Design
  • Engineering
  • Technology

Here’s why it’s important to build long-term cryptographic resilience

  • December 24, 2024
IBM and Ferrari Premium Partner
View Post
  • Data
  • Engineering

IBM Selected as Official Fan Engagement and Data Analytics Partner for Scuderia Ferrari HP

  • November 7, 2024

Stay Connected!
LATEST
  • 1
    Just make it scale: An Aurora DSQL story
    • May 29, 2025
  • 2
    Reliance on US tech providers is making IT leaders skittish
    • May 28, 2025
  • Examine the 4 types of edge computing, with examples
    • May 28, 2025
  • AI and private cloud: 2 lessons from Dell Tech World 2025
    • May 28, 2025
  • 5
    TD Synnex named as UK distributor for Cohesity
    • May 28, 2025
  • Weigh these 6 enterprise advantages of storage as a service
    • May 28, 2025
  • 7
    Broadcom’s ‘harsh’ VMware contracts are costing customers up to 1,500% more
    • May 28, 2025
  • 8
    Pulsant targets partner diversity with new IaaS solution
    • May 23, 2025
  • 9
    Growing AI workloads are causing hybrid cloud headaches
    • May 23, 2025
  • Gemma 3n 10
    Announcing Gemma 3n preview: powerful, efficient, mobile-first AI
    • May 22, 2025
about
Hello World!

We are aster.cloud. We’re created by programmers for programmers.

Our site aims to provide guides, programming tips, reviews, and interesting materials for tech people and those who want to learn in general.

We would like to hear from you.

If you have any feedback, enquiries, or sponsorship request, kindly reach out to us at:

[email protected]
Most Popular
  • Understand how Windows Server 2025 PAYG licensing works
    • May 20, 2025
  • By the numbers: How upskilling fills the IT skills gap
    • May 21, 2025
  • 3
    Cloud adoption isn’t all it’s cut out to be as enterprises report growing dissatisfaction
    • May 15, 2025
  • 4
    Hybrid cloud is complicated – Red Hat’s new AI assistant wants to solve that
    • May 20, 2025
  • 5
    Google is getting serious on cloud sovereignty
    • May 22, 2025
  • /
  • Technology
  • Tools
  • About
  • Contact Us

Input your search keywords and press Enter.