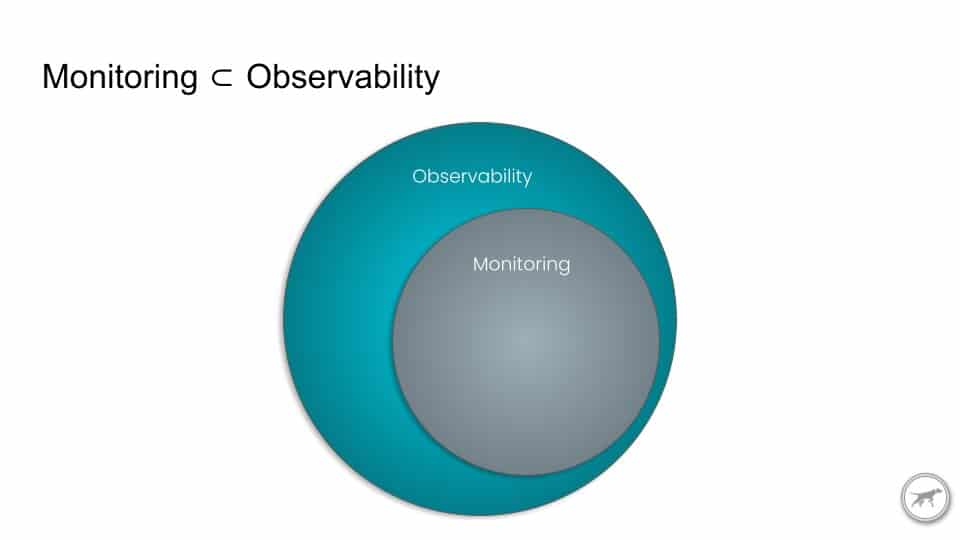
You’ve likely heard the term Observability lately. There’s a fundamental change taking place in the Monitoring space, and Observability is behind it. Observability itself is a broad topic, so in this post we’ll talk about what it means to move from Application Performance Monitoring to Application Performance Observability.
APM – APPLICATION PERFORMANCE MONITORING
If you’ve used a traditional APM service, like Scout, you’ve likely installed a library into your application from that APM provider. This library, or agent, would then gather metrics and application traces while your application runs in production.
From our partners:
Traces, But Still Heavily Metrics Based
Traditional APM agents collect detailed traces about what happens under the hood to in order for your application to serve transactions to end users. But they are also heavily metrics based. They generate predefined, aggregate metrics about the performance of the application as a whole. Metrics like throughput, response time averages and percentiles, etc. A dead giveaway as to whether a service is geared towards Monitoring or Observability is the overwhelming presence of dashboards for metrics. That’s not to say dashboards have no place in an Observability tool, but they should not be the main feature. You shouldn’t be investing a significant amount of time setting up or maintaining dashboards.
Missing Context
Because traditional APM services are still heavily metrics based, there is a huge amount of missing context in the data. Without the contextual information from every application trace, it’s impossible to ask important questions like “What changed? Why? Who is affected?”. The detailed traces collected from APM tools are selected based on a simple sampling strategy, or in Scout’s case, a smart algorithm to pick out the most interesting and useful traces that a Developer would want to see in order to understand performance issues within their application. Our intelligent algorithm is great at selecting these traces and pointing Developers to problematic issues quickly, but we know we’re only scratching the surface of the potential for these traces.
Long Tail Problems
Traditional Application Monitoring is proficient at addressing the performance issues that impact the majority of users. Big picture problems, like “Is the site up?”, or “Is the 95% response time within our SLA?” can be answered with Monitoring. The long tail questions can only be addressed with an Observability solution. “Show me all users that had response times over our SLA threshold at any time this month”, “The 95% response time increased within the last hour. Show me all services that are involved in servicing these requests, and which users are impacted”, “User X is having long load times on endpoint Y. Show me all traces from user X on endpoint Y”. Observability enables the ability to ask these questions and much more about your applications.
No Standardization == Wasted Effort
APM providers wrote what are called agents that would dynamically inject code (instruments) into your application’s frameworks and libraries such as Rails, Redis, MongoDB, etc., in order to measure and collect telemetry data from your running application. This process of instrumentation was difficult, tedious, and delicate work, and each APM provider wrote their own which meant there was duplicated/wasted effort in simply getting frameworks and libraries instrumented.
Siloed Data, Or Settle for a Subpar Single Pane
Particular languages supported, robustness of APIs, consistency of naming conventions, and a multitude of factors prevents the sharing or integration of Monitoring data. Ops, Developers, SRE, DevOps all have their favorite tools. Each respectively chose the best tool to meet their needs in the past, which led to tool and service sprawl. Going for that single pane of glass? Get ready for some major subpar trade-offs for at least a few of these teams in order to get everyone on the same service.
APO – APPLICATION PERFORMANCE OBSERVABILITY
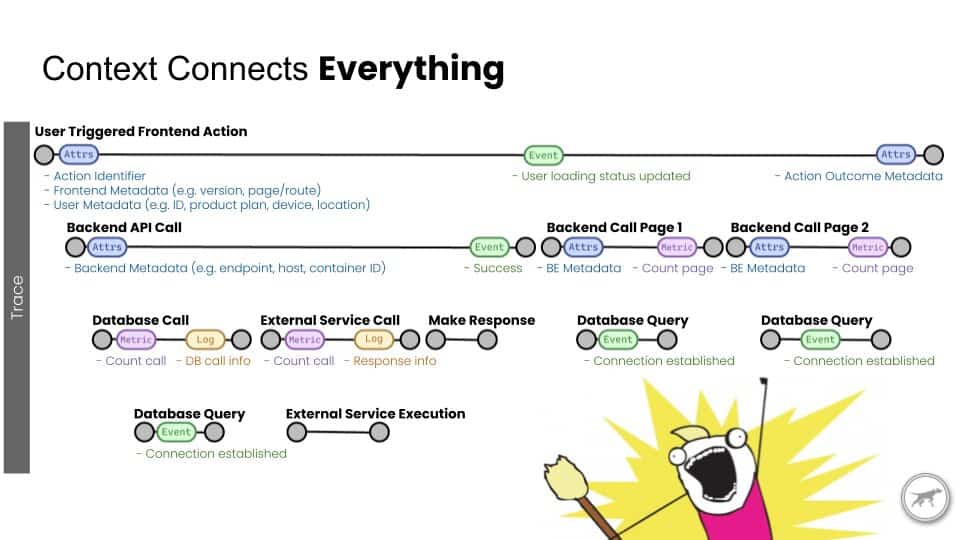
All of the Context
Instead of the APM agent determining which aggregated metrics to collect ahead of time, collect every application trace. When needed, derive metrics from the traces on demand. Slice and dice on facets of contextual information contained in the traces on demand. Contextual data is the cornerstone to be able to ask crucial Observability questions and answer those Long Tail issues.
Standardized Specification
Implementing standards, cross language, and cross platform is a massive undertaking. You must be able to issue a query to answer your Observability questions across all languages you run in production, and know that the context is applied and located in the same place across your applications. A framework that defines these standards is a must for Observability.
Community and Developer Support
The standardized specification point has a huge influence here. Here’s a list of some of the external interface port types I remember having to use on computers over the years: Parallel, RS232, DB9, VGA, S-Video, DVI, DisplayPort, HDMI, MIDI, RCA, Component, Toslink, RJ11, RJ45, PCMCIA, SCSI, eSATA, AT, PS/2, Firewire. Yes, I do have a box full of cables to connect to any one of these, sans PCMCIA…
Did you notice what was missing in the list? Right, USB! Of course I have a million USB cables. Because every single thing that connects to my computer is now USB. Sure, different form factors, but the protocol is magically backwards compatible. If you can make it fit, or flip it upside down once or twice – or more – it just works! This is the kind of standard every peripheral device manufacturer got behind because it’s so well designed. This is a huge part of what’s shaping the Observability landscape and finally getting an overwhelming amount of providers and developers to back a single specification: OpenTelemetry.
Deep Correlations
I’ll stay on theme here: standardization. It’s what allows us to make deep correlations based on rich context not just within a single application, but across applications, languages, and up and down the infrastructure stack. When a computer can understand what a piece of data represents, and its universally and consistently applied and attached to production data, we can really leverage machine assistance in the process of performance and operational debugging.
Change in Development Culture
Observability is not a tooling-only endeavor. It’s not a magic pill that you swallow and suddenly you’re Bradley Cooper in Limitless with omniscient Observability superpowers. Observability needs to be baked into your own code and stack intentionally. It’s an ingredient you must remember to add while you’re baking your own code. You may have already made the first additions with a proprietary APM solution to measure custom code or attach custom context. This is a great start, but you need to make sure it’s a regular thought from developers when writing and reviewing code. “Does this service boundary/method/block/etc need to be measured?”, “How do I know this piece of code will perform as expected?”, “How can I measure the change of utilization/performance of this code over time?”, “How many nano/milli/seconds elapsed from A to B? Is there a limit I must ensure we don’t hit?”, “When I need to review performance of these traces in the future, what contextual information should I make sure to attach now?”
WHAT’S ENABLING OBSERVABILITY
Cost Efficient Compute and Storage for High Cardinality Big Data
Observability is all about high cardinality and big data sets. Cloud compute and storage cost has hit an inflection point. We can now leverage these cloud services for on-demand processing to answer the questions Observability demands and provide them at a reasonable cost to our users.
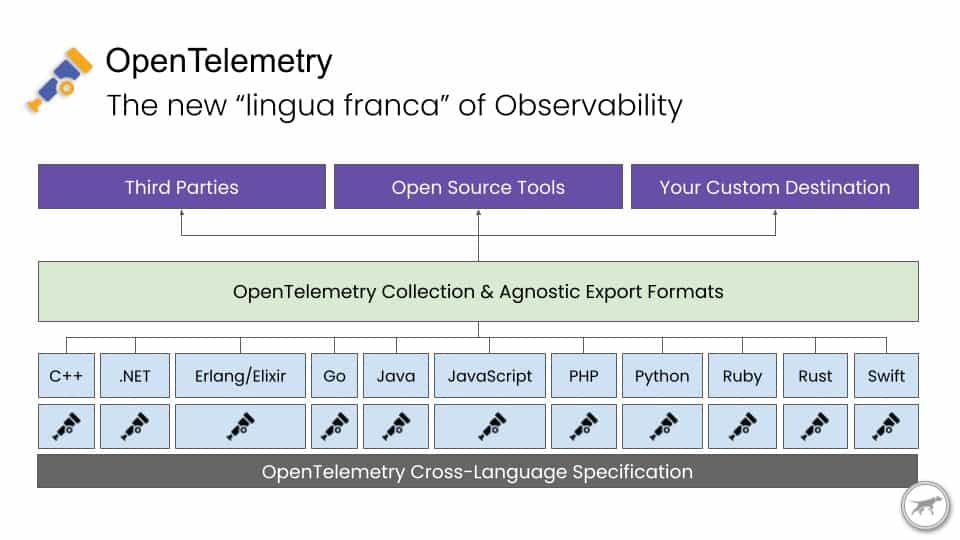
Open Source Observability APIs/SDKs with Broad Support.
We’re finally seeing the convergence of multiple competing standards being coalesced into one, with a huge amount of community and industry support: OpenTelemetry! The OpenTelemetry Specification defines the cross-language data specifications including the API, SDKs, and transport protocols. These are forming the new ‘lingua franca’ for Observability, allowing the full stack to speak the same language, gather data in the same format, and ultimately transport that data for processing. This is the crucial puzzle piece required in order to make Observability truly ubiquitous.
APPLICATION PERFORMANCE OBSERVABILITY
OpenTelemetry is leveling the playing field with regard to collecting, processing, and transmitting telemetry data with rich context across all popular languages and system stacks with uniform conventions. This focuses the value prop of Observability providers onto what insights and value you can derive from this newly unified data. This is an inflection point in the monitoring and observability landscape, and the next few years promise to be extremely interesting.
At Scout, we’re building a new Observability platform based on OpenTelemetry. We’re focused on continuing to provide actionable insights that surface issues quickly, enabling your developers to confidently address any performance issues in ever more complex applications and infrastructure. If you’re interested in early access, visit https://scoutapm.com/observability.
Guest post originally published on the Scout APM blog by Dave Anderson, CTO, Scout APM
Source CNCF
For enquiries, product placements, sponsorships, and collaborations, connect with us at [email protected]. We'd love to hear from you!
Our humans need coffee too! Your support is highly appreciated, thank you!