Pub/Sub offers a rich set of metrics for resource and usage monitoring. Previously, these metrics were like buried treasure: they were useful to understand Pub/Sub usage, but you had to dig around to find them. Today, we are announcing out-of-the-box Pub/Sub metrics dashboards that are accessible with one click from the Topics and Subscriptions pages in the Google Cloud Console. These dashboards provide more observability in context and help you build better solutions with Pub/Sub.
Check out our new one-click monitoring dashboards

From our partners:
We added metrics dashboards to monitor the health of all your topics and subscriptions in one place, including dashboards for individual topics and subscriptions. Follow these steps to access the new monitoring dashboards:
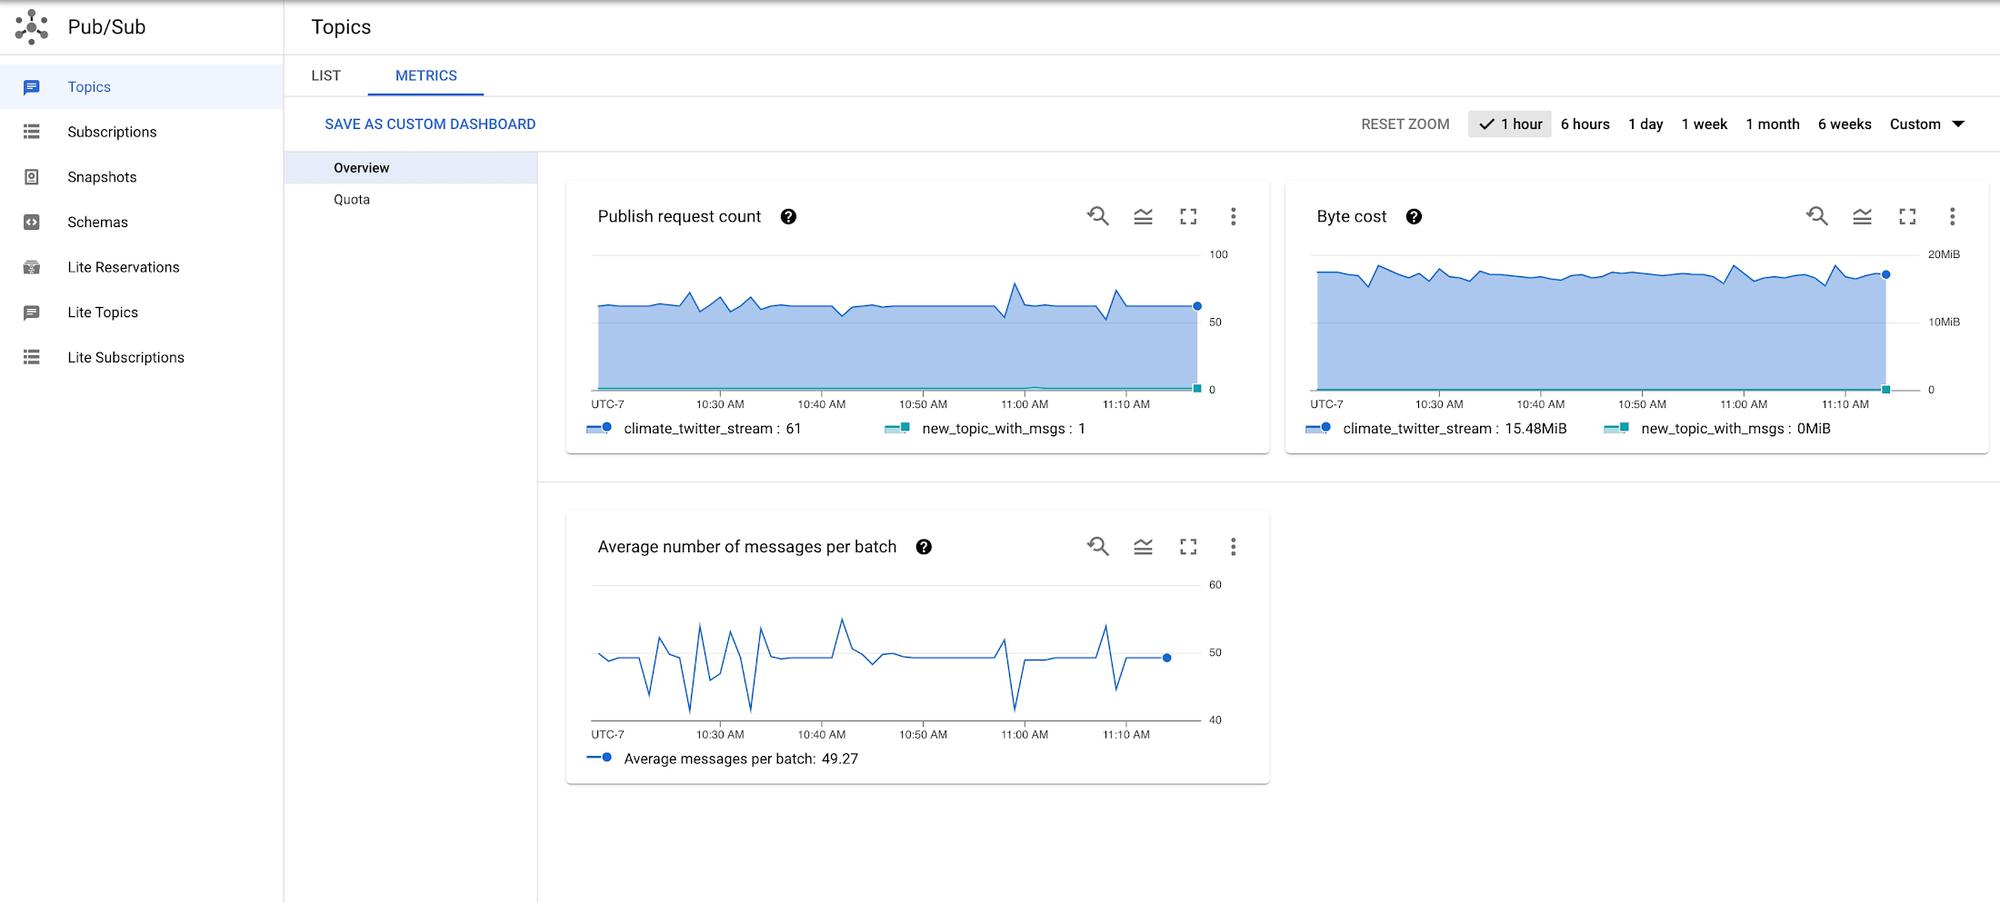
- To view the monitoring dashboard for all the topics in your project, open the Pub/Sub Topics page and click the Metrics tab. This dashboard has two sections: Overview and Quota.
- To view the monitoring dashboard for a single topic, in the Pub/Sub Topics page, click any topic to display the topic detail page, and then click the Metrics tab. This dashboard has up to three sections: Overview, Subscriptions, and Retention (if topic retention is enabled).
- To view the monitoring dashboard for all the subscriptions in your project, open the Pub/Sub Subscriptions page and click the Metrics tab. This dashboard has two sections: Overview and Quotas.
- To view the monitoring dashboard for a single subscription, in the Pub/Sub Subscriptions page, click any subscription to display the subscription detail page, and then click the Metrics tab. This dashboard has up to four sections: Overview, Health, Retention (if acknowledged message retention is enabled), and either Pull or Push depending on the delivery type of your subscription.
A few highlights
When exploring the new Pub/Sub metrics dashboard, here are a few examples of things you can do. Please note that these dashboards are a work in progress, and we hope to update them based on your feedback. To learn about recent changes, please refer to the Pub/Sub monitoring documentation.
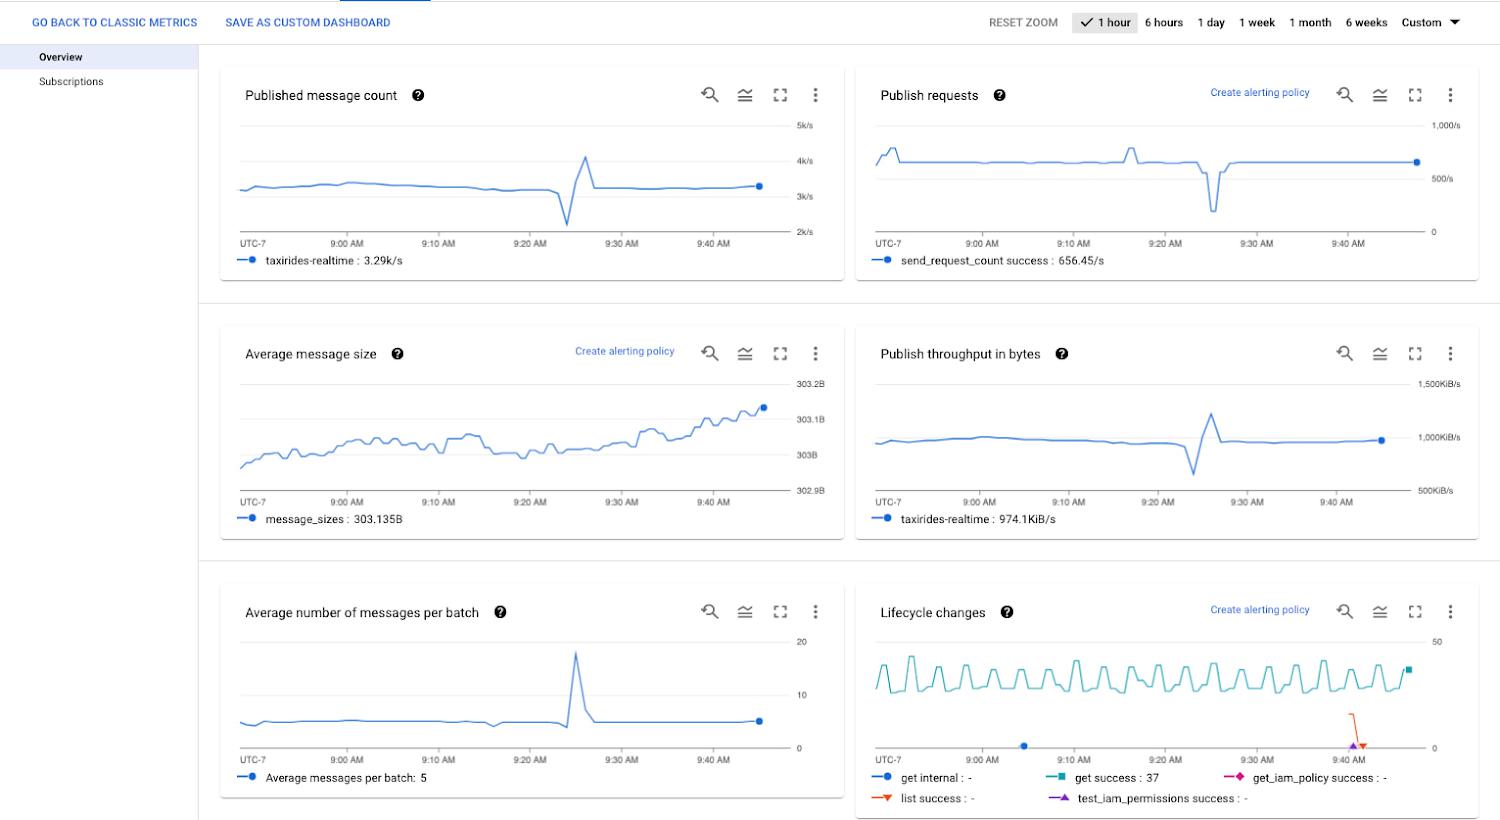
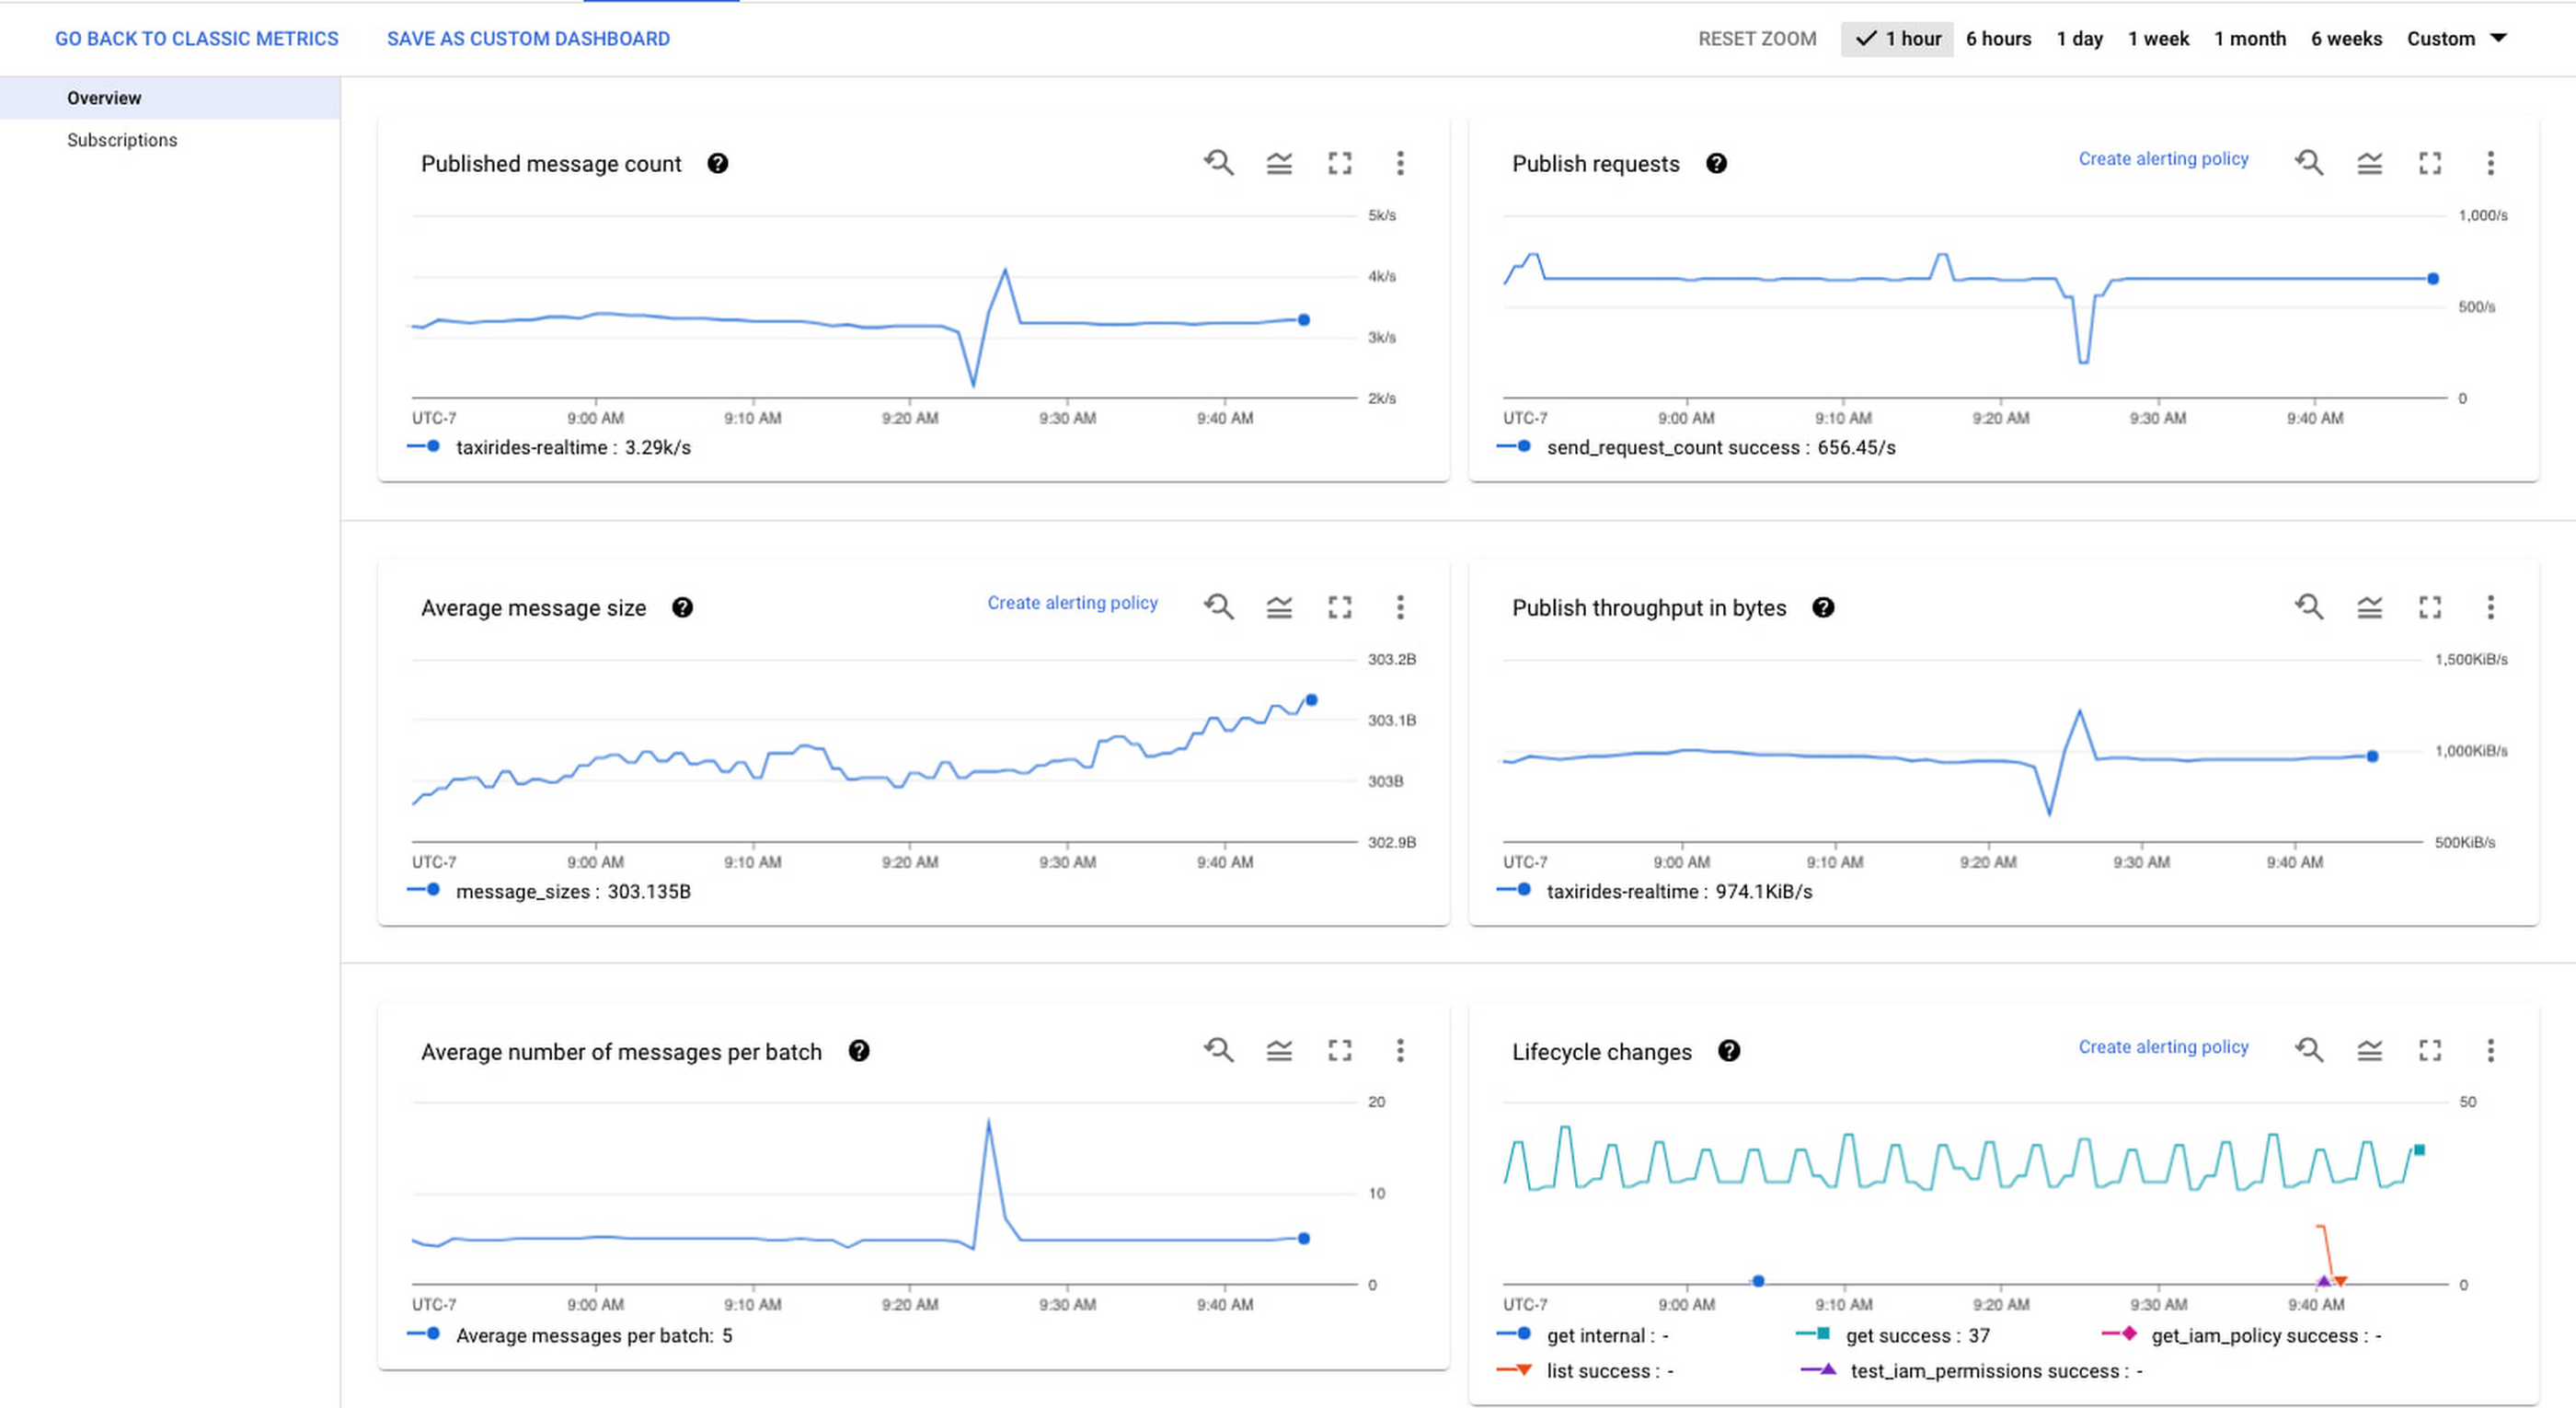
As you can see, the metrics available in the monitoring dashboard for a single topic are closely related to one another. Roughly speaking, you can obtain Publish throughput in bytes by multiplying Published message count and Average message size. Because a publish request is made up of a batch of messages, dividing Published messages by Publish request count gets you Average number of messages per batch. Expect a higher number of published messages than publish requests if your publisher client has batching enabled.
Some interesting questions you can answer by looking at the monitoring dashboard for a single topic are:
- Did my message sizes change over time?
- Is there a spike in publish requests?
- Is my publish throughput in line with my expectations?
- Is my batch size appropriate for the latency I want to achieve, given that larger batch sizes increase publish latency?
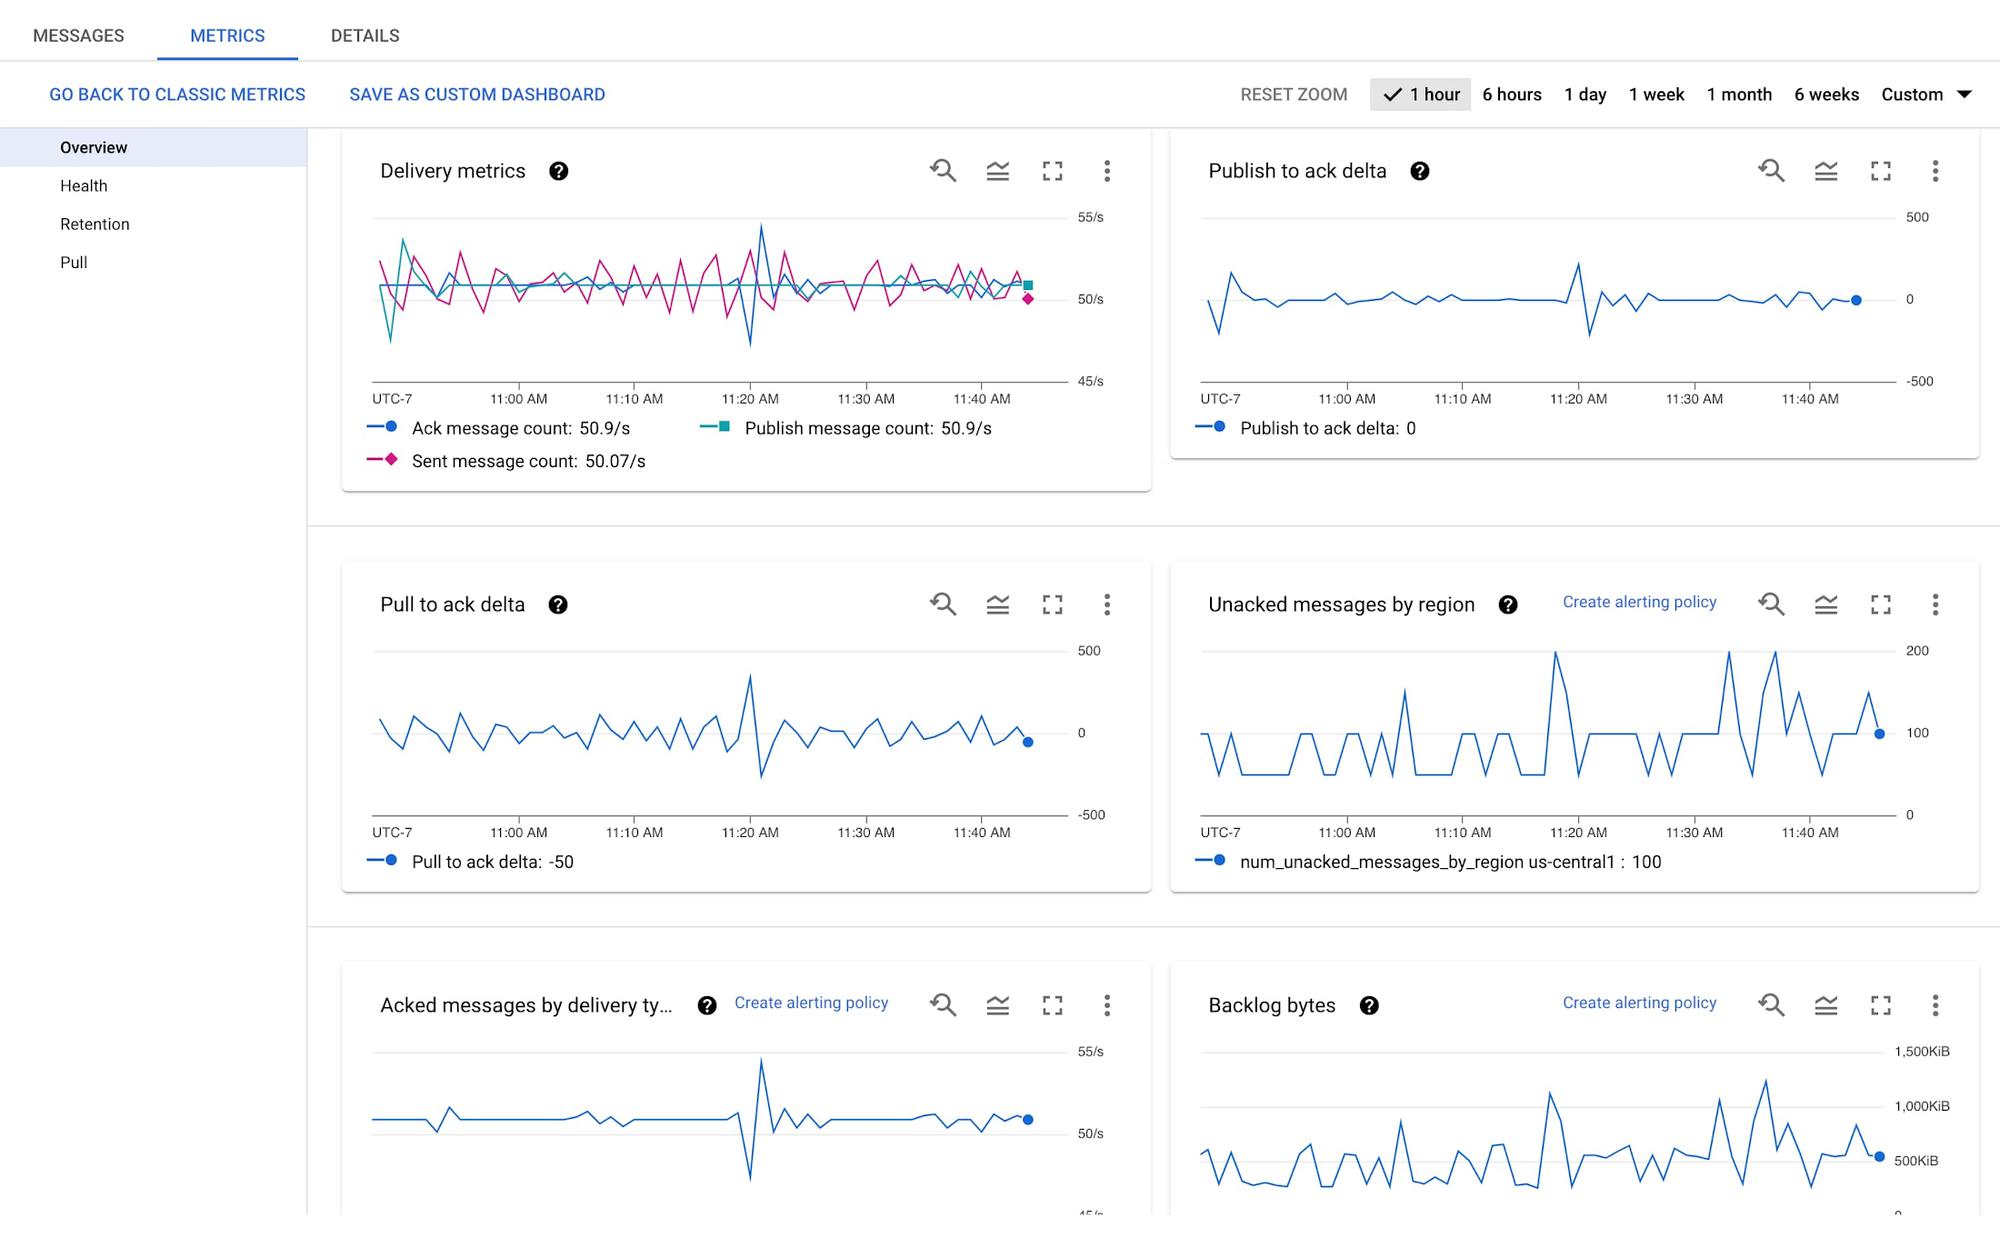
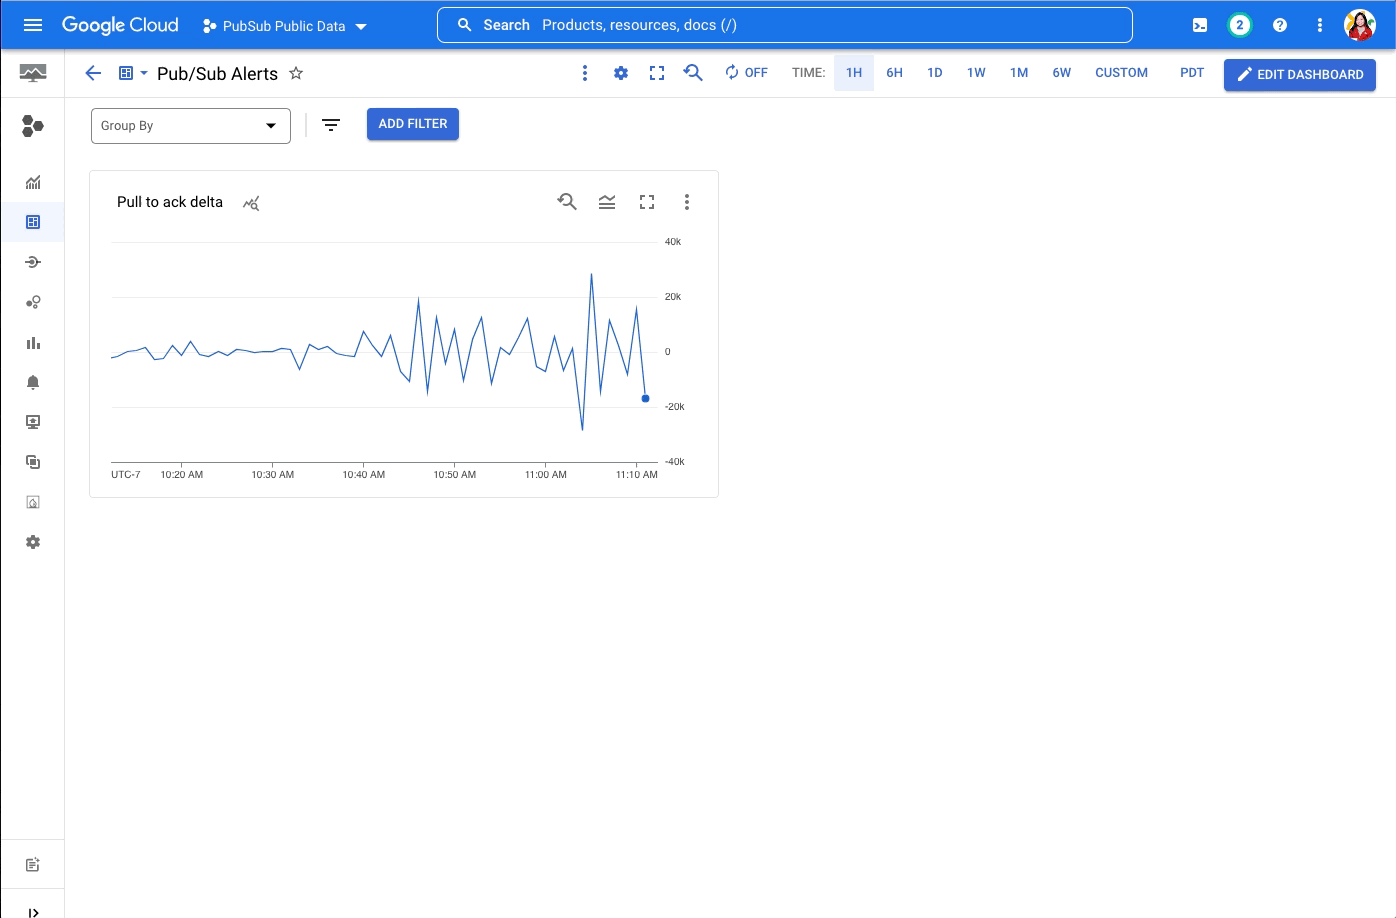
You can find a few powerful composite metrics in the monitoring dashboard for a single subscription. These metrics are Delivery metrics, Publish to ack delta, and Pull to ack delta. All three aim to give you a sense of how well your subscribers are keeping up with incoming messages. Delivery metrics display your publish, pull, and acknowledge (ack) rate next to each other. Pull to ack delta and Publish to ack delta offer you the opportunity to drill down to any specific bottlenecks. For example, if your subscribers are pulling messages a lot faster than they are acknowledging them, expect the values reported in Pull to ack delta to be mostly above zero. In this scenario, also expect both your Unacked messages by region and your Backlog bytes to grow. To remedy this situation, you can increase your message processing power or setting up subscriber flow control.
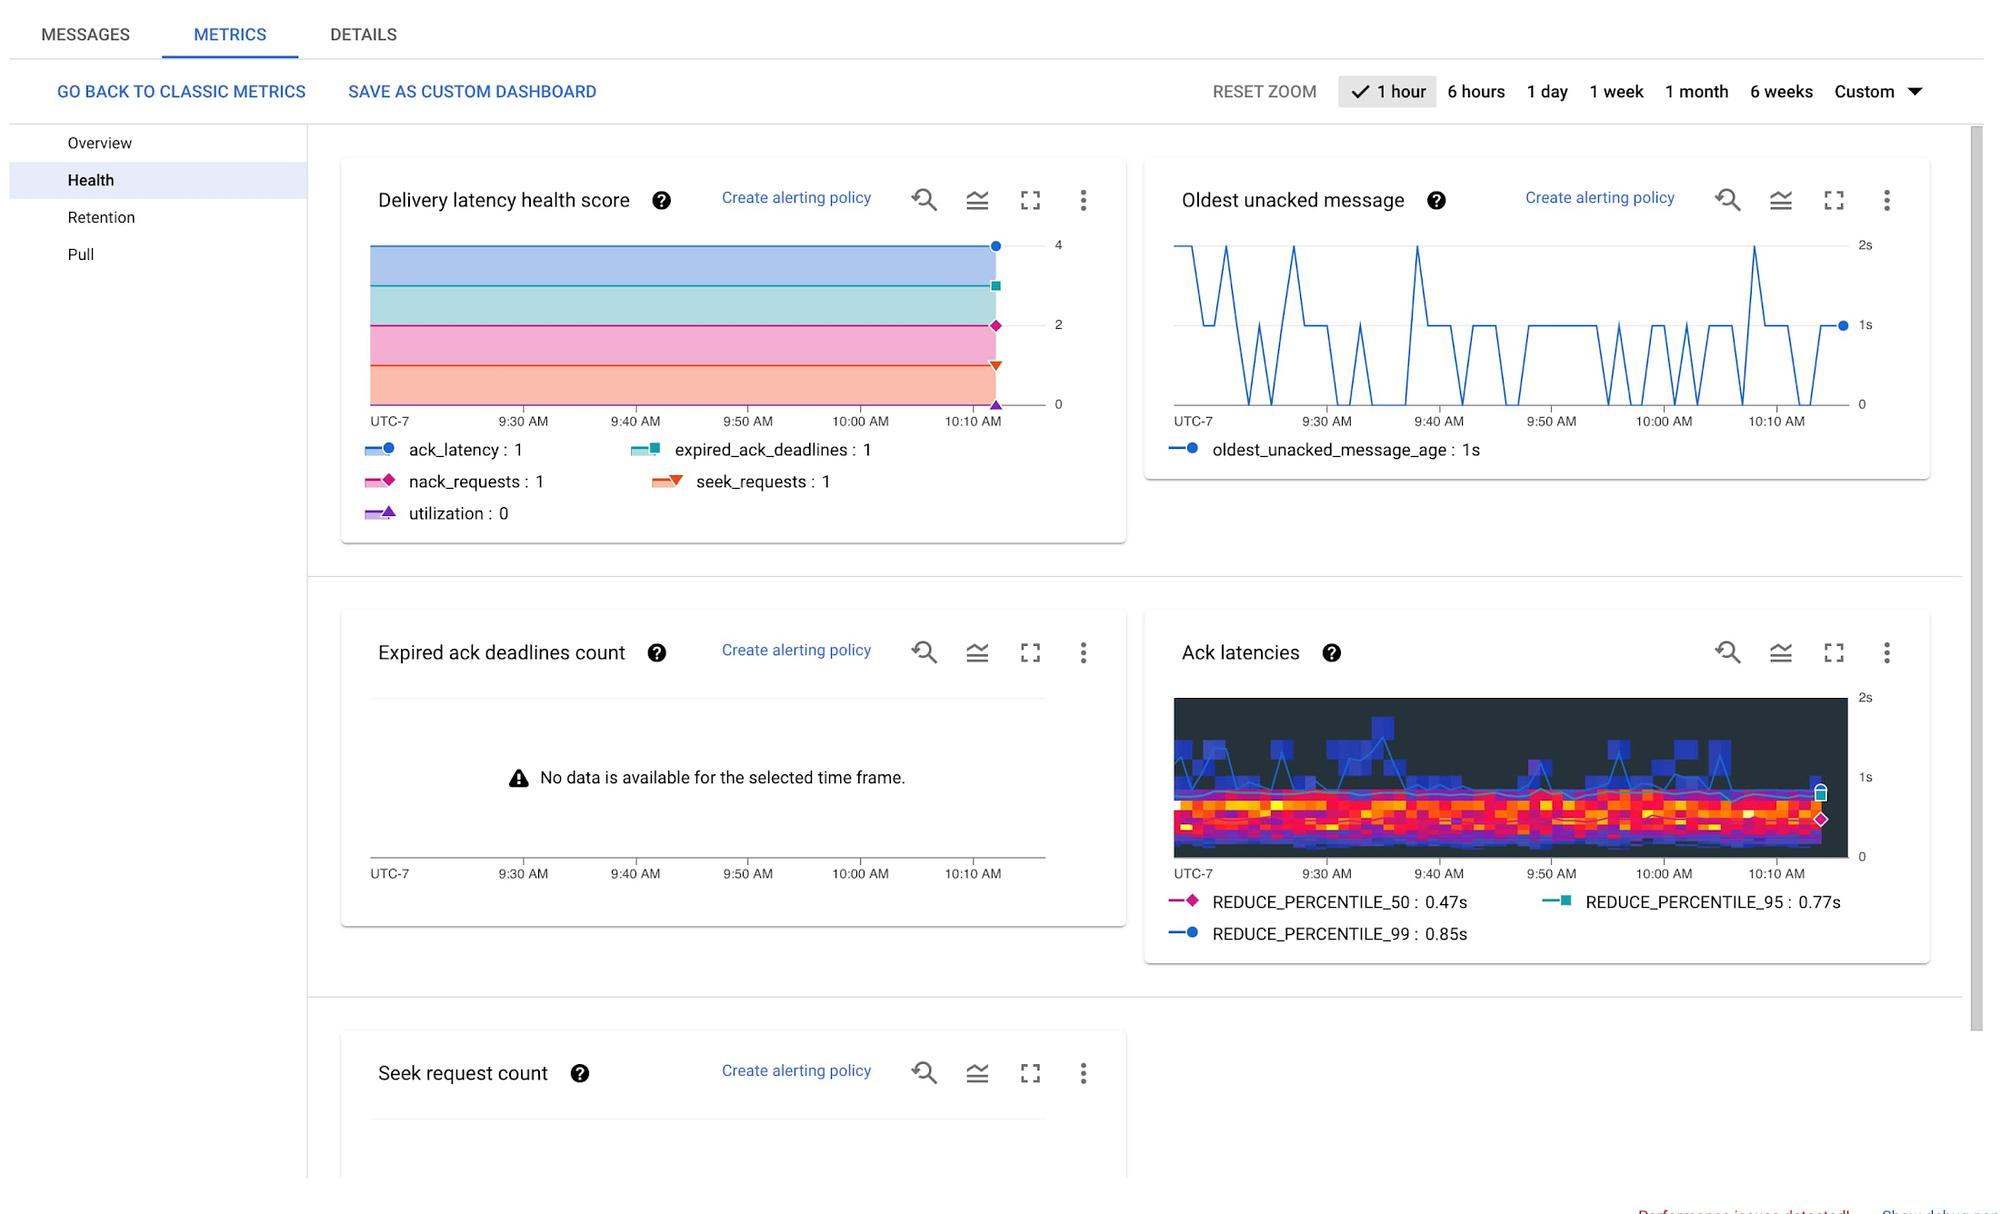

Another powerful composite metric available in the monitoring dashboard for a single subscription is the Delivery latency health score in the Health section. You may treat this metric as a one-stop shop to examine the health of your subscription. This metric tracks a total of five properties; each can take a value of zero or one. If your subscribers are not keeping up, zero scores for “ack_latency” and/or “expired_ack_deadlines” effectively tell you that those properties are the reason why. We prescribe how to fix these failing scores in our documentation. If your subscription is run by a managed service like Dataflow, do not be alarmed by a “utilization” score of zero. With Dataflow, the number of streams open to receive messages is optimized, so the recommendation to open more streams does not apply.
Some questions you can answer by looking at your monitoring dashboard for a single subscription are:
- What is the 99th percentile of my ack latencies? Is the majority of my messages getting acknowledged in under a second, allowing my application to run in near real-time?
- How well are my subscribers keeping up with my publishers?
- Which region has a growing backlog?
- How frequently are my subscribers allowing a message’s ack deadline to expire?
Customize your monitoring experience
Hopefully the existing dashboards are enough to diagnose a problem. But maybe you need something slightly different. If that’s the case, from the dropdown menu, click Save as Custom Dashboard to save an entire dashboard in your list of monitoring dashboards, or click Add to Custom Dashboard in a specific chart to save the chart to a custom dashboard. Then, in the custom dashboard, you can edit any chart configuration or MQL query.
For example, by default, the Top 5 subscriptions by ack message count chart in the Subscriptions section of the monitoring dashboard for a single topic shows the top five attached subscriptions with the highest rate of acked messages. You can modify the dashboard to show the top ten subscriptions. To make the change, export the chart, click on the chart, and edit the line of MQL “| top 5, .max()” to “| top 10, .max()”. To know more about editing in MQL, see Using the Query Editor | Cloud Monitoring.
For a slightly more complex example, you can build a chart that compares current data to past data. For example, consider the Byte Cost chart in the Overview section of the monitoring dashboard for all topics. You can view the chart in Metrics Explorer. In the MQL tab, add the following lines at the end of the provided code snippet:
| {add [when: "now"];add [when: "then"] | time_shift 1d}| union
The preceding lines turn the original chart to a comparison chart that compares data at the same time on the previous day. For example, if your Pub/Sub topic consists of application events like requests for cab rides, data from the previous day can be a nice baseline for current data and can help you set the right expectations for your business or application for the current day. If you’d prefer, update the chart type to a Line chart for easier comparison.
Set alerts
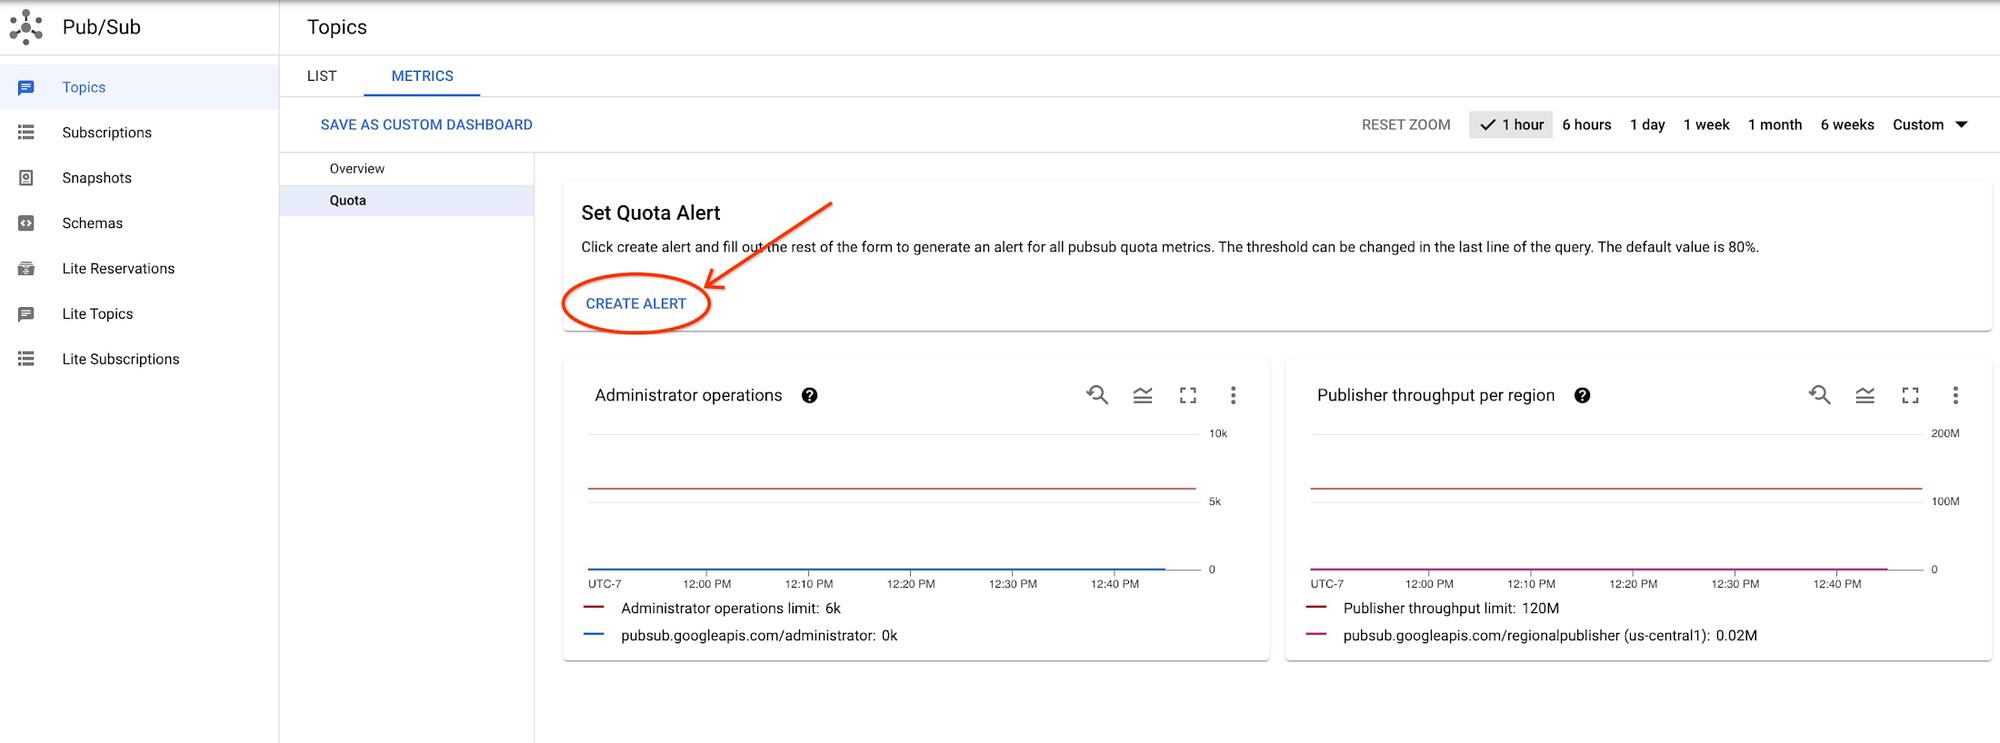
Quota limits can creep up on you when you least expect it. To prevent this, you can set up alerts that will notify you once you hit certain thresholds. The Pub/Sub dashboards have a built-in function to help you set up these alerts. First, access the Quota section in one of the monitoring dashboards for topics or subscriptions. Then, click Create Alert inside the Set Quota Alert card at the top of the dashboard. This will take you to the alert creation form with an MQL query that triggers for any quota metric exceeding 80% capacity (the threshold can be modified).

In fact, all the provided charts support setting alerting policies. You can set up your alerting policies by first exporting a chart to a custom dashboard and then selecting Convert a provided chart to an alert chart, using the dropdown menu.

For example, you might want to trigger an alert if the pull to ack delta is positive more than 90% of the time during a 12-hour period. This would indicate that your subscription is frequently pulling messages faster than it is acknowledging them. First, export the Pull to Ack Delta chart to a custom dashboard, convert it to an alert chart, and add the following line of code at the end of the provided MQL query:
| condition gt(val(), 0)
Then, click Configure trigger. Set the Alert trigger to Percent of time series violates, the Minimum percent of time series in violation to 90%, and Trigger when condition is met for this amount of time to 12 hours. If the alert is created successfully, you should see a new chart with a red horizontal line representing the threshold with a text bubble that tells you if there have been any open incidents violating the condition.
You can also add an alert for the Oldest unacked message metric. Pub/Sub lets you set a message retention period on your subscriptions. Aim to keep your oldest unacked messages within the configured subscription retention period, and fire an alert when messages are taking longer than expected to be processed.
Making metrics dashboards that are easy to use and serve your needs is important for us. We welcome your feedback and suggestions for any of the provided dashboards and charts. You can reach us by clicking on the question icon on the top right corner in Cloud Console and choosing Send feedback. If you really like a chart, please let us know too! We will be delighted to hear from you.
By: Tianzi Cai (Developer Relations Engineer) and Charles Thorson (Software Engineer)
Source: Google Cloud Blog
For enquiries, product placements, sponsorships, and collaborations, connect with us at [email protected]. We'd love to hear from you!
Our humans need coffee too! Your support is highly appreciated, thank you!