aster.cloud aster.cloud
  • /
  • Platforms
    • Public Cloud
    • On-Premise
    • Hybrid Cloud
    • Data
  • Architecture
    • Design
    • Solutions
    • Enterprise
  • Engineering
    • Automation
    • Software Engineering
    • Project Management
    • DevOps
  • Programming
    • Learning
  • Tools
  • About
  • /
  • Platforms
    • Public Cloud
    • On-Premise
    • Hybrid Cloud
    • Data
  • Architecture
    • Design
    • Solutions
    • Enterprise
  • Engineering
    • Automation
    • Software Engineering
    • Project Management
    • DevOps
  • Programming
    • Learning
  • Tools
  • About
aster.cloud aster.cloud
  • /
  • Platforms
    • Public Cloud
    • On-Premise
    • Hybrid Cloud
    • Data
  • Architecture
    • Design
    • Solutions
    • Enterprise
  • Engineering
    • Automation
    • Software Engineering
    • Project Management
    • DevOps
  • Programming
    • Learning
  • Tools
  • About
  • Design
  • Engineering
  • Practices

3 Best Practices To Reduce Application Downtime With Google Cloud’s API Monitoring Tools

  • aster.cloud
  • December 7, 2022
  • 6 minute read
How many times have you closed an application when you encounter the “spinning wheel of death” (a melodramatic way of saying an application that is taking too long to load)? In today’s digital economy where many organizations rely on applications as a primary source of revenue, that spinning wheel of death (or poor application performance) can mean lost users or revenue. And just about every modern application relies on APIs as the nervous system across distributed systems, third-party services and microservice architectures. While meeting the need for rapid release cycles and frequent API updates, it is also imperative for IT teams to ensure that your APIs are meeting SLOs, performance requirements, and proactively mitigating issues.

Why are synthetic monitoring tools not enough?

When thousands or even millions of users are making multiple requests to your APIs, just relying on synthetic monitoring tools (that rely on sampling or limited API availability information) is not enough for precision diagnoses or useful forensics. At the same time, monitoring every single aspect just increases your overhead and mean time to diagnosis. Apropos, API monitoring has become absolutely critical — and a fusion of art and science — for operations teams to make sure all APIs are running and performing as intended. If you are worried about monitoring blind spots or overheads, let us look at 3 key practices you can follow to stop dreading your sev1 alerts.


Partner with aster.cloud
for your next big idea.
Let us know here.


From our partners:

CITI.IO :: Business. Institutions. Society. Global Political Economy.
CYBERPOGO.COM :: For the Arts, Sciences, and Technology.
DADAHACKS.COM :: Parenting For The Rest Of Us.
ZEDISTA.COM :: Entertainment. Sports. Culture. Escape.
TAKUMAKU.COM :: For The Hearth And Home.
ASTER.CLOUD :: From The Cloud And Beyond.
LIWAIWAI.COM :: Intelligence, Inside and Outside.
GLOBALCLOUDPLATFORMS.COM :: For The World's Computing Needs.
FIREGULAMAN.COM :: For The Fire In The Belly Of The Coder.
ASTERCASTER.COM :: Supra Astra. Beyond The Stars.
BARTDAY.COM :: Prosperity For Everyone.

#1 Prioritize alerts for critical events requiring immediate investigation

Ask any engineer on-call for a critical service and they will tell you about the overheads created by incorrectly prioritized alerts. For example let us imagine a distributed application with 20 APIs. Even if you set up basic alert monitors across latency, error, and traffic for these APIs, you end up monitoring and maintaining 60 alert definitions – which is a lot. To balance avoiding monitoring blindspots and alert fatigue at the same time, operations teams must develop a clear understanding of all events and prioritize configuring alerts for events supporting critical traffic.

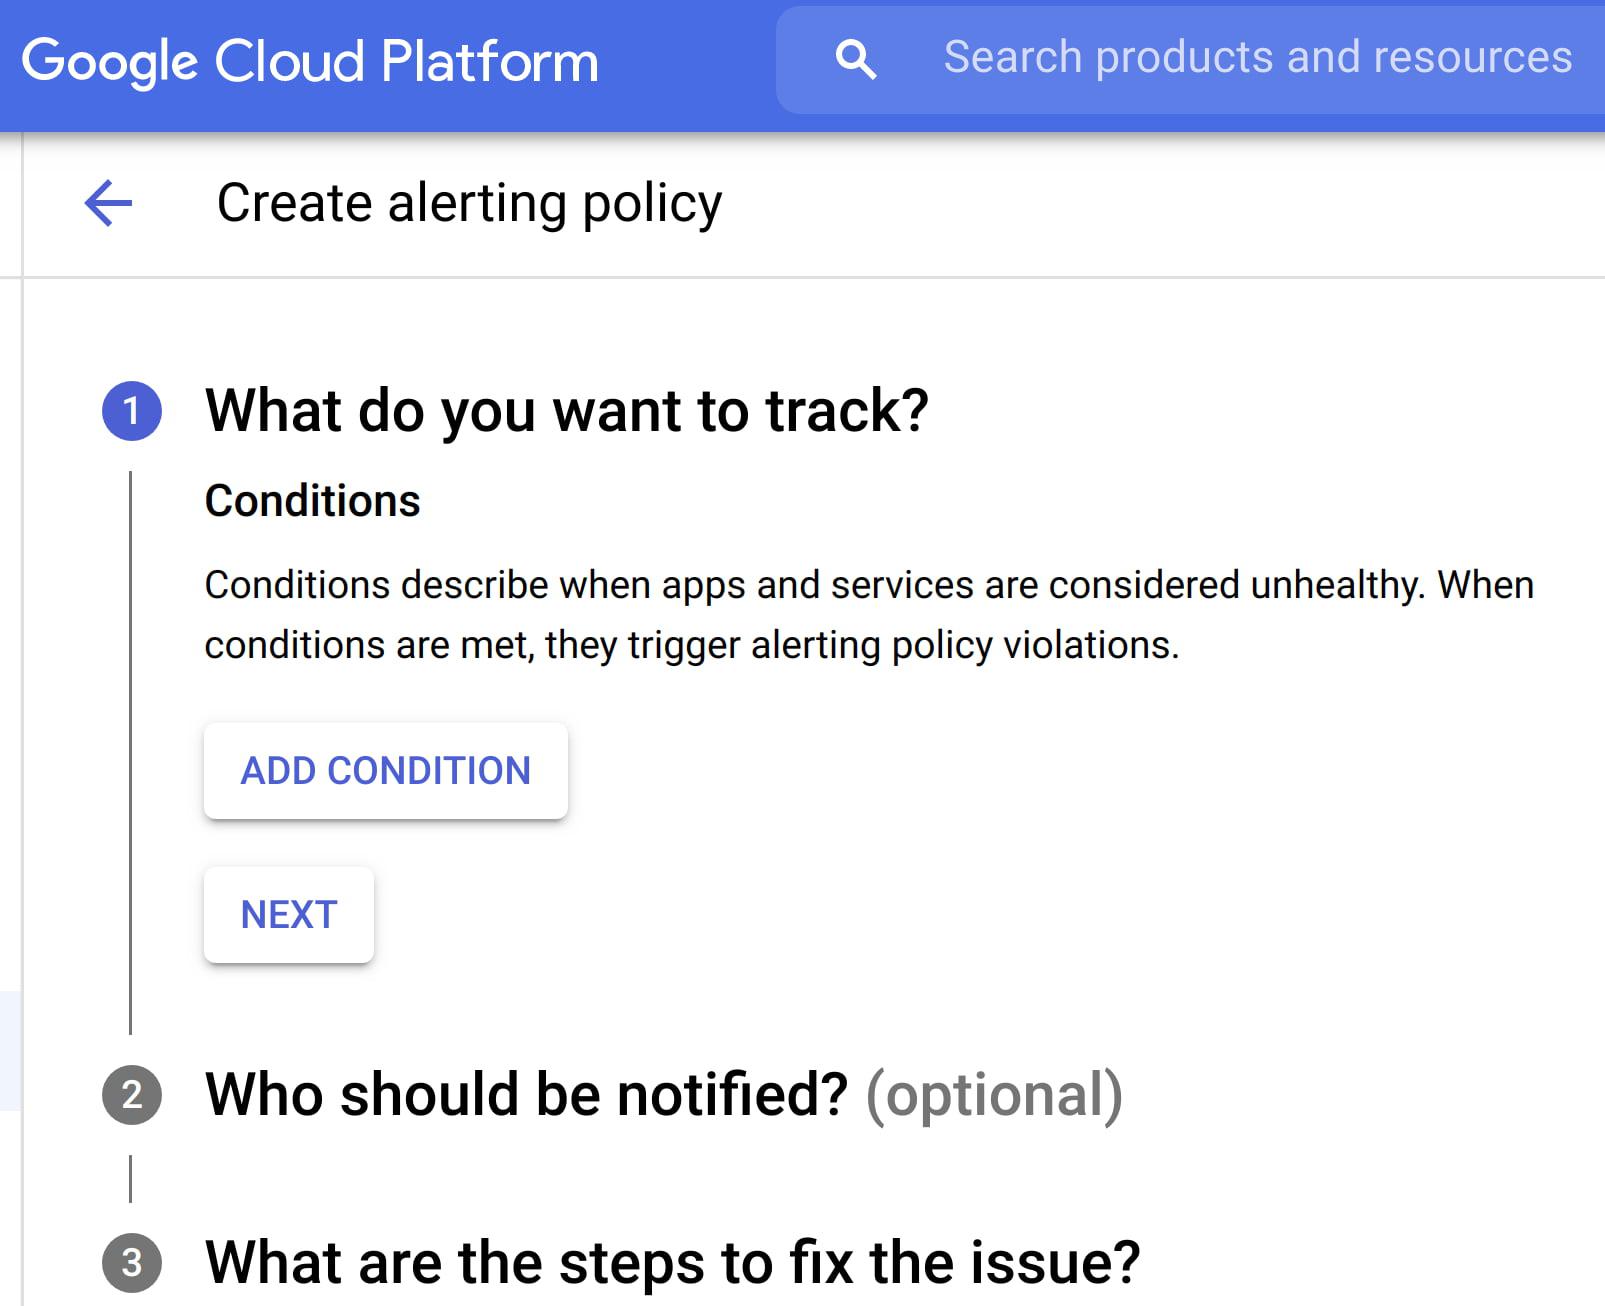
  • Consider quality over quantity while defining new alert conditions where each new condition is urgent, actionable, and actively or imminently user-visible. Every alert condition created should also contain intelligence that requires active engagement from a user as opposed to a mere robotic response. Apigee’s API monitoring allows creation of alert conditions based on metrics or logs while providing actionable information (Ex: status code, rate etc.,) and playbooks for diagnosis
  • In today’s multilayered systems, one team’s symptom (“what’s broken?”) is another downstream system’s cause (“Why?”). Even if some events are not suitable for actionable alerts, a failure needs to create an informational broadcast to a downstream system to mitigate the impact of the upstream dependency. In such cases, investing in automating alerts, grouping multiple incidents in notification channels, and incident tracking. For example, Apigee lets you integrate and group your alert notifications in channels like Slack, Pagerduty, webhooks etc.,
  • Modern production systems are ever-evolving where an alert that’s currently rare might become frequent and automatable. Analogous to ticket backlog grooming, alert policies need to be reviewed periodically to make sure new conditions are identified and existing alerts are refined with new thresholds, prioritization and correlation. Controls like Advanced API Ops leverage AI and ML to detect anomalous traffic differentiated from random fluctuations to help define accurate alert definitions
Read More  Google Cloud Now The Most Favored Platform For Research Globally, According To Ipsos

Check out some examples of alerts here

#2 Isolate problem areas quickly with dashboards

Google’s Site Reliability Engineering book presents the case for efficient diagnosis by building dashboards that answer basic questions about every service, normally including some form of the four golden signals — latency, traffic, errors and saturation. But at the same time, capturing just these golden metrics at different levels of granularity can quickly add up. Like all software systems, monitoring can become an endless pit of complexity, complicated to change and a burden to maintain. In the same book, the most effective direction to create a well-functioning standalone system is to collect and aggregate basic metrics, paired with alerting and dashboards.

If you are running a large scale API program with a dedicated team to monitor your APIs, you can leverage the out-of-the-box monitoring dashboards in your API Management solution (like Apigee’s API monitoring) to gather real-time insights into your API performance, availability, latency, and errors. In other cases, you can use solutions like Cloud Monitoring that can provide visibility across your full application stack where individual metrics, events, and metadata can be visualized in a rich query language for rapid analysis. Leveraging a single system for your application stack provides observability in context and can reduce your time spent navigating between systems (Apigee customers can use Cloud Monitoring by default or integrate with other systems using Cloud Monitoring API)

Even after you collect and aggregate the metrics, it is important to have impactful data visualizations to quickly understand the issue and identify correlations during diagnosis. In data visualizations as well, focusing on too many dashboards creates a steep learning curve and increases mean time for every diagnosis. For example, Apigee API Monitoring provides the following visualizations as a standard to balance simplicity and efficiency:

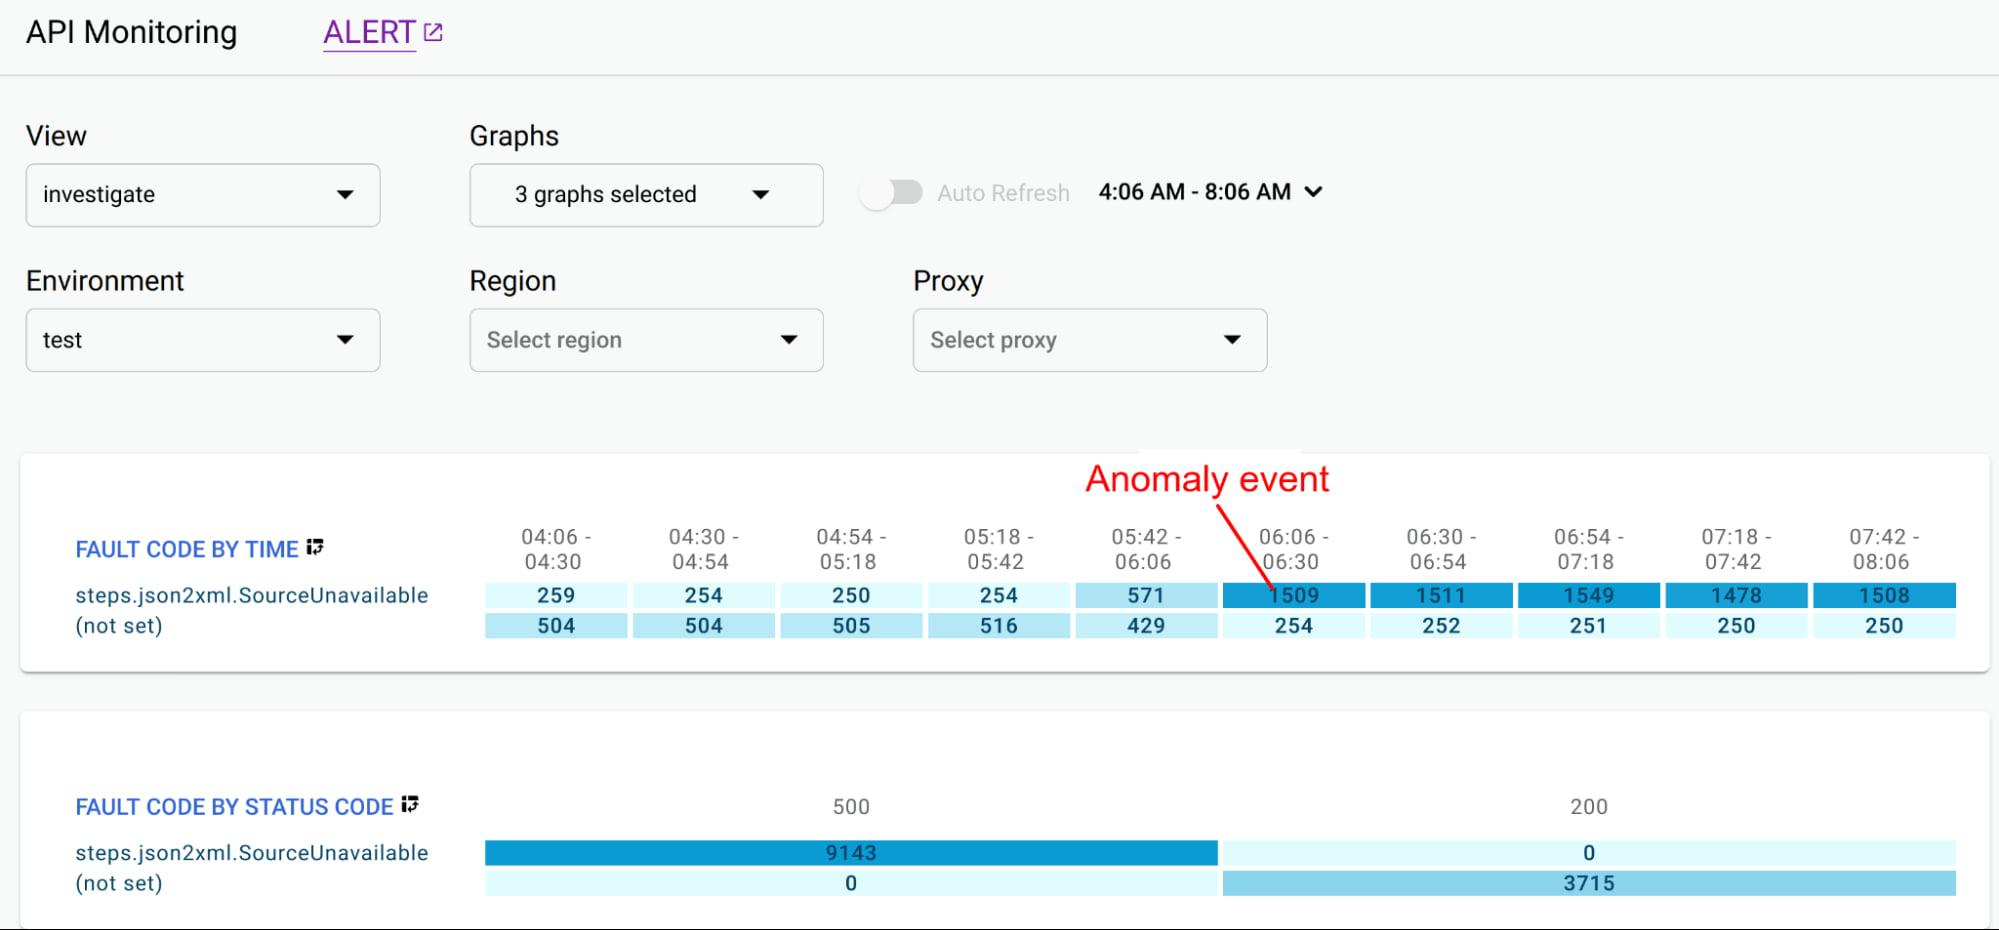
  • Timeline view to diagnose traffic (in 1 min intervals), error rates (4xx and 5xx across traffic) and latencies (50th, 90th, 95th and 99th percentiles)
  • Pivot tables of metrics and attributes for all API traffic, to help compare activity across different metrics
  • Treemaps of recent API traffic by proxy to get a snapshot of incidents, error rates and latencies
Read More  Cloud Makes It Better: What's New And Next For Data Security

#3 Incorporate distributed tracing into your end to end observability strategy

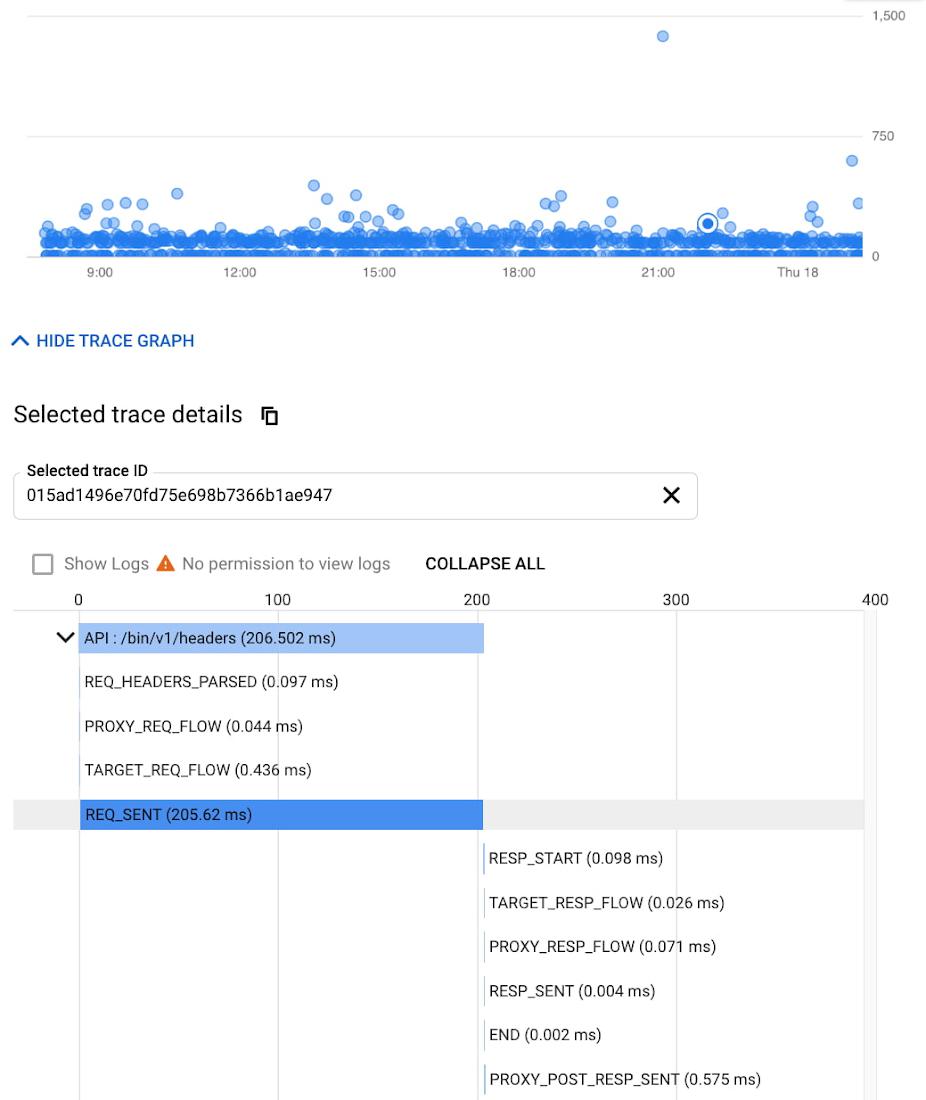
Modern application development accelerated the adoption of technologies and practices like cloud, containers, APIs, microservice architectures, DevOps, SRE etc. While this increases release velocity, it also introduces complexity and more points of failure in an application stack. For example, a slow response to a customer request spans across multiple micro services owned (and monitored) by various teams who might not observe any individual performance issues. Without an end-to-end contextual view of a request, it is nearly impossible to isolate the point of high latency.

In such cases, distributed tracing is the best way for DevOps, Operations and SREs to get answers to questions such as service health, root cause of defects, or performance bottlenecks in a distributed system. Organizations should invest in instrumenting their distributed applications using open source standards such as OpenCensus and Zipkin. Using tools like Cloud Trace with a broad platform, language and environment support can help easily ingest data from any source — open instrumentation or proprietary agents.

While distributed tracing helps in narrowing the issue to a given service, in some cases you might need further context to pinpoint the root cause. For example: Even if you have isolated the source of a performance issue to an API proxy, it is still a tedious process to identify the right bottleneck among multiple policies being executed. Tools like Apigee Debug enable you to zoom into an API proxy flow and probe the details of each step to see internal details like policy executions, performance issues, and routing etc.,As soon as a request starts to span across a handful of microservices, tools like distributed tracing and Debug will become crucial elements of your monitoring strategy. When every service in a distributed system emits a trace, the amount of data can quickly become overwhelming leading to the classic “needle in the haystack” problem. In such scenarios, it becomes vital to ask the right questions and choose between head-based sampling (randomly selecting which traces will be sampled for analysis) and tail-based sampling (observe all trace information and sample the traces with unusual latency or errors) based on application complexity

Read More  BigQuery Connector For SAP: Power Your Cloud Data Analytics Strategy

Implement effective API monitoring in Apigee

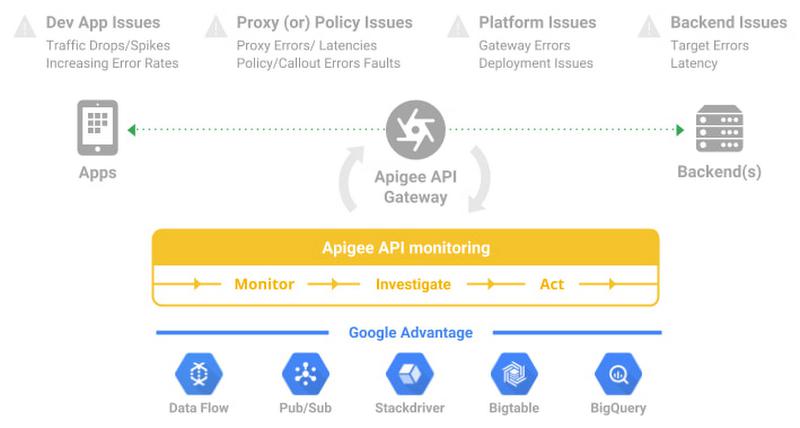
Apigee’s API monitoring (based on metrics exposed by the internals of the system) capabilities work with your existing monitoring infrastructure to help reduce mean time to diagnosis and increase application resiliency. Specifically, operations teams can leverage

  • Monitoring dashboards to gain in-depth insights into API availability and performance metrics.
  • Debug to precisely diagnose with deeper insights into an API proxy flow without toggling multiple tools.
  • Alerts and notifications to gather contextual Insights, facilitate customization, and grouping with first class integrations to various tools (like Slack, PagerDuty, email and support for webhooks).
  • Best of Google technologies such as Data Flow, Pub/Sub, Stackdriver, Bigtable and BigQuery to handle massive volumes and complex metrics at scale

Using Apigee’s API monitoring will help you maintain high application resiliency with comprehensive controls to reduce mean time to diagnosis and resolution. Get started with Apigee today or explore Apigee’s API monitoring for free here. Check out our documentation for additional information on API monitoring.


By: Varun Krovvidi (Product Marketing Manager, Google Cloud) and Rachel Richardson (Head of Product Marketing, Business Application Platform, Google Cloud)
Source: Google Cloud Blog


For enquiries, product placements, sponsorships, and collaborations, connect with us at [email protected]. We'd love to hear from you!

Our humans need coffee too! Your support is highly appreciated, thank you!

aster.cloud

Related Topics
  • API Management
  • Apigee
  • Best Practice
  • Google Cloud
  • Monitoring
You May Also Like
View Post
  • Engineering
  • Technology

Guide: Our top four AI Hypercomputer use cases, reference architectures and tutorials

  • March 9, 2025
View Post
  • Computing
  • Engineering

Why a decades old architecture decision is impeding the power of AI computing

  • February 19, 2025
View Post
  • Engineering
  • Software Engineering

This Month in Julia World

  • January 17, 2025
View Post
  • Engineering
  • Software Engineering

Google Summer of Code 2025 is here!

  • January 17, 2025
View Post
  • Data
  • Engineering

Hiding in Plain Site: Attackers Sneaking Malware into Images on Websites

  • January 16, 2025
View Post
  • Computing
  • Design
  • Engineering
  • Technology

Here’s why it’s important to build long-term cryptographic resilience

  • December 24, 2024
IBM and Ferrari Premium Partner
View Post
  • Data
  • Engineering

IBM Selected as Official Fan Engagement and Data Analytics Partner for Scuderia Ferrari HP

  • November 7, 2024
View Post
  • Engineering

Transforming the Developer Experience for Every Engineering Role

  • July 14, 2024

Stay Connected!
LATEST
  • college-of-cardinals-2025 1
    The Definitive Who’s Who of the 2025 Papal Conclave
    • May 7, 2025
  • conclave-poster-black-smoke 2
    The World Is Revalidating Itself
    • May 6, 2025
  • oracle-ibm 3
    IBM and Oracle Expand Partnership to Advance Agentic AI and Hybrid Cloud
    • May 6, 2025
  • 4
    Conclave: How A New Pope Is Chosen
    • April 25, 2025
  • Getting things done makes her feel amazing 5
    Nurturing Minds in the Digital Revolution
    • April 25, 2025
  • 6
    AI is automating our jobs – but values need to change if we are to be liberated by it
    • April 17, 2025
  • 7
    Canonical Releases Ubuntu 25.04 Plucky Puffin
    • April 17, 2025
  • 8
    United States Army Enterprise Cloud Management Agency Expands its Oracle Defense Cloud Services
    • April 15, 2025
  • 9
    Tokyo Electron and IBM Renew Collaboration for Advanced Semiconductor Technology
    • April 2, 2025
  • 10
    IBM Accelerates Momentum in the as a Service Space with Growing Portfolio of Tools Simplifying Infrastructure Management
    • March 27, 2025
about
Hello World!

We are aster.cloud. We’re created by programmers for programmers.

Our site aims to provide guides, programming tips, reviews, and interesting materials for tech people and those who want to learn in general.

We would like to hear from you.

If you have any feedback, enquiries, or sponsorship request, kindly reach out to us at:

[email protected]
Most Popular
  • 1
    Tariffs, Trump, and Other Things That Start With T – They’re Not The Problem, It’s How We Use Them
    • March 25, 2025
  • 2
    IBM contributes key open-source projects to Linux Foundation to advance AI community participation
    • March 22, 2025
  • 3
    Co-op mode: New partners driving the future of gaming with AI
    • March 22, 2025
  • 4
    Mitsubishi Motors Canada Launches AI-Powered “Intelligent Companion” to Transform the 2025 Outlander Buying Experience
    • March 10, 2025
  • PiPiPi 5
    The Unexpected Pi-Fect Deals This March 14
    • March 13, 2025
  • /
  • Technology
  • Tools
  • About
  • Contact Us

Input your search keywords and press Enter.