aster.cloud aster.cloud
  • /
  • Platforms
    • Public Cloud
    • On-Premise
    • Hybrid Cloud
    • Data
  • Architecture
    • Design
    • Solutions
    • Enterprise
  • Engineering
    • Automation
    • Software Engineering
    • Project Management
    • DevOps
  • Programming
    • Learning
  • Tools
  • About
  • /
  • Platforms
    • Public Cloud
    • On-Premise
    • Hybrid Cloud
    • Data
  • Architecture
    • Design
    • Solutions
    • Enterprise
  • Engineering
    • Automation
    • Software Engineering
    • Project Management
    • DevOps
  • Programming
    • Learning
  • Tools
  • About
aster.cloud aster.cloud
  • /
  • Platforms
    • Public Cloud
    • On-Premise
    • Hybrid Cloud
    • Data
  • Architecture
    • Design
    • Solutions
    • Enterprise
  • Engineering
    • Automation
    • Software Engineering
    • Project Management
    • DevOps
  • Programming
    • Learning
  • Tools
  • About
  • Technology

Monitoring GPU Workloads On GKE With NVIDIA Data Center GPU Manager (DCGM)

  • aster.cloud
  • December 31, 2022
  • 9 minute read

Artificial intelligence (AI) and machine learning (ML) have become an increasingly important enterprise capability, including use cases such as product recommendations, autonomous vehicles, application personalization, and automated conversational platforms. Building and deploying ML models demand high-performance infrastructure. Using NVIDIA GPUs can greatly accelerate the training and inference system. Consequently, monitoring GPU performance metrics to understand workload behavior is critical for optimizing the ML development process.

Many organizations use Google Kubernetes Engine (GKE) to manage NVIDIA GPUs to run production AI inference and training at scale. NVIDIA Data Center GPU Manager (DCGM) is a set of tools from NVIDIA to manage and monitor NVIDIA GPUs in cluster and datacenter environments. DCGM includes APIs for collecting a detailed view of GPU utilization, memory metrics, and interconnect traffic. It provides the system profiling metrics needed for ML engineers to identify bottlenecks and optimize performance, or for administrators to identify underutilized resources and optimize for cost.In this blog post we demonstrate:


Partner with aster.cloud
for your next big idea.
Let us know here.


From our partners:

CITI.IO :: Business. Institutions. Society. Global Political Economy.
CYBERPOGO.COM :: For the Arts, Sciences, and Technology.
DADAHACKS.COM :: Parenting For The Rest Of Us.
ZEDISTA.COM :: Entertainment. Sports. Culture. Escape.
TAKUMAKU.COM :: For The Hearth And Home.
ASTER.CLOUD :: From The Cloud And Beyond.
LIWAIWAI.COM :: Intelligence, Inside and Outside.
GLOBALCLOUDPLATFORMS.COM :: For The World's Computing Needs.
FIREGULAMAN.COM :: For The Fire In The Belly Of The Coder.
ASTERCASTER.COM :: Supra Astra. Beyond The Stars.
BARTDAY.COM :: Prosperity For Everyone.

  • How to setup NVIDIA DCGM in your GKE cluster, and
  • How to observe the GPU utilization using either a Cloud Monitoring Dashboard or Grafana with Prometheus.

NVIDIA Data Center GPU Manager

NVIDIA DCGM simplifies GPU administration, including setting configuration, performing health checks, and observing detailed GPU utilization metrics. Check out NVIDIA’s DCGM user guide to learn more.

Here we focus on the gathering and observing of GPU utilization metrics in a GKE cluster. To do so, we also make use of NVIDIA DCGM exporter. This component collects GPU metrics using NVIDIA DCGM and exports them as Prometheus style metrics.

GPU Monitoring Architecture

The following diagram describes the high-level architecture of the GPU monitoring setup using NVIDIA DCGM, NVIDIA DCGM Exporter, and Google Managed Prometheus,Google Cloud’s managed offering for Prometheus.


In the above diagram, the boxes labeled “NVIDIA A100 GPU” represent an example NVIDIA GPU attached to a GCE VM Instance. Dependencies amongst components are traced out by the wire connections.The “AI/ML workload” represents a pod that has been assigned one or more GPUs. The boxes “NVIDIA DCGM” and “NVIDIA DCGM exporter” are pods running as privileged daemonset across the GKE cluster. A ConfigMap contains the list of DCGM fields (in particular GPU metrics) to collect.The “Managed Prometheus” box represents managed prometheus components deployed in the GKE cluster. This component is configured to scrape Prometheus style metrics from the “DCGM exporter” endpoint. “Managed Prometheus” exports each metric to Cloud Monitoring as “prometheus.googleapis.com/DCGM_NAME/gauge.” The metrics are accessible through various Cloud Monitoring APIs, including the Metric Explorer page.To provide greater flexibility, we also include components that can set up an in-cluster Grafana dashboard. This consists of a “Grafana” pod that accesses the available GPU metrics through a “Prometheus UI” front end as a data source. The Grafana page is then made accessible at a Google hosted endpoint through an “Inverse Proxy” agent.

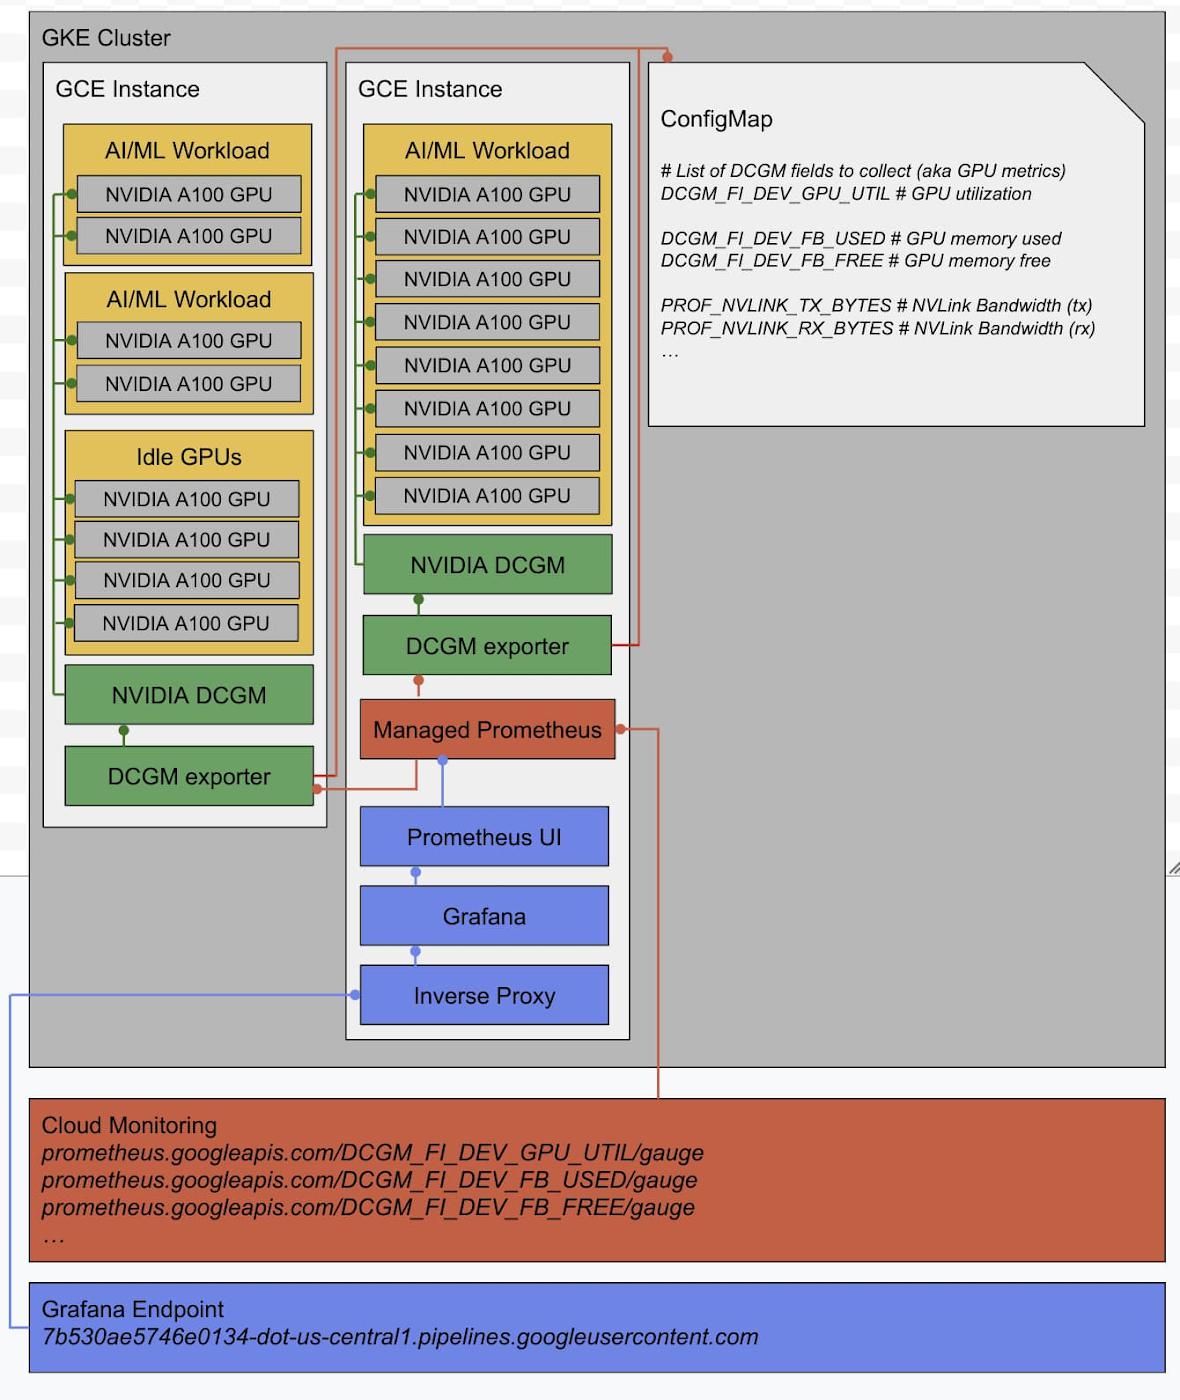
All the GPU monitoring components are deployed to a namespace “gpu-monitoring-system.”

Requirements

  • Google Cloud Project
  • Quota for NVIDIA GPUs (more information at GPU quota)
  • GKE version 1.21.4-gke.300 with “beta” component to install Managed Prometheus.
  • GKE version 1.18.6-gke.3504 or above to support all available cloud GPU types.
  • NVIDIA Datacenter GPU Manager requires NVIDIA Driver R450+.

Deploy a Cluster with NVIDIA GPUs

1. Follow the instructions at Run GPUs in GKE Standard node pools to create a GKE cluster with NVIDIA GPUs.

Here is an example to deploy a cluster with two A2 VMs with 2 x NVIDIA A100 GPUs each. For a list of available GPU platforms by region, see GPU regions and zones.

Read More  Training LLMs With AMD MI250 GPUs And MosaicML
gcloud beta container clusters create CLUSTER_NAME \
  --zone us-central1-f \
  --machine-type=a2-highgpu-2g \
  --num-nodes=2 \
  --enable-managed-prometheus

Note the presence of the “–enable-managed-prometheus” flag. This allows us to skip the next step. By default a cluster will deploy the Container-Optimized OS on each VM.2. Enable Managed Prometheus on this cluster. It allows us to collect and export our GPU metrics to Cloud Monitoring. It will also be used as a data source for Grafana.
gcloud beta container clusters update CLUSTER_NAME \
  --zone ZONE \
  --enable-managed-prometheus

3. Before you can use kubectl to interact with your GKE cluster, you need to fetch the cluster credentials.
gcloud container clusters get-credentials CLUSTER_NAME \
  --zone us-central1-f

4. Before we can interact with the GPUs, we need to install the NVIDIA drivers. The following installs NVIDIA drivers for VMs running the Contained-Optimised OS.
kubectl apply -f \
https://raw.githubusercontent.com/GoogleCloudPlatform/container-engine-accelerators/master/nvidia-driver-installer/cos/daemonset-preloaded.yaml

Wait for “nvidia-gpu-device-plugin” to go Running across all nodes. This can take a couple minutes.
kubectl get pods -n kube-system | grep nvidia-gpu-device-plugin

Download GPU Monitoring System Manifests

Download the Kubernetes manifest files and dashboards used later in this guide.

git clone https://github.com/suffiank/dcgm-on-gke && cd dcgm-on-gke

Configure GPU Monitoring System

Before we deploy the NVIDIA Data Center GPU manager and related assets, we need to select which GPU metrics we want to emit from the cluster. We also want to set the period at which we sample those GPU metrics. Note that all these steps are optional. You can choose to keep the defaults that we provide.

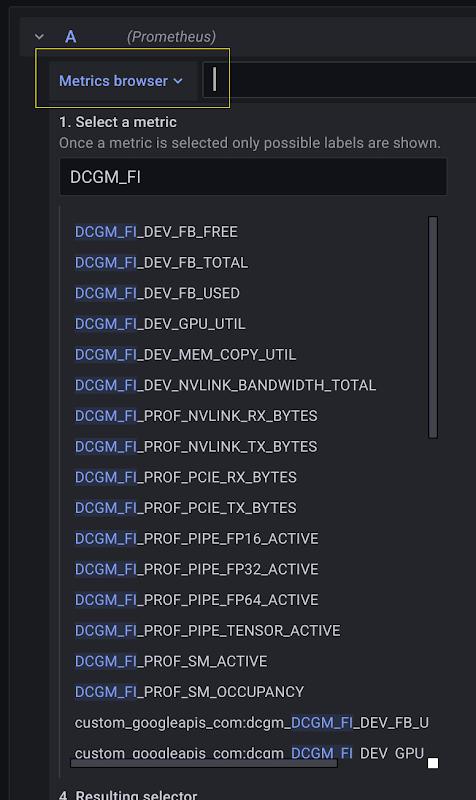
1. View and edit the ConfigMap section of quickstart/dcgm_quickstart.yml to select which GPU metrics to emit:

apiVersion: v1
kind: ConfigMap
metadata:
  name: nvidia-dcgm-exporter-metrics
…
data:
  counters.csv: |
    # Utilization (the sample period varies depending on the product),,
    DCGM_FI_DEV_GPU_UTIL, gauge, GPU utilization (in %).
    DCGM_FI_DEV_MEM_COPY_UTIL, gauge, Memory utilization (in %).

    # Utilization of IP blocks,,
    DCGM_FI_PROF_SM_ACTIVE, gauge, 
    DCGM_FI_PROF_SM_OCCUPANCY, gauge,
    DCGM_FI_PROF_PIPE_TENSOR_ACTIVE, gauge, 
    DCGM_FI_PROF_PIPE_FP64_ACTIVE, gauge, 
    DCGM_FI_PROF_PIPE_FP32_ACTIVE, gauge, 
    DCGM_FI_PROF_PIPE_FP16_ACTIVE, gauge, 

    # Memory usage,,
    DCGM_FI_DEV_FB_FREE, gauge,
    DCGM_FI_DEV_FB_USED, gauge,
    DCGM_FI_DEV_FB_TOTAL, gauge,

    # PCIE,,
    DCGM_FI_PROF_PCIE_TX_BYTES, gauge,
    DCGM_FI_PROF_PCIE_RX_BYTES, gauge, 

    # NVLink,,
    DCGM_FI_PROF_NVLINK_TX_BYTES, gauge, 
    DCGM_FI_PROF_NVLINK_RX_BYTES, gauge,

A complete list of NVIDIA DCGM fields available are at NVIDIA DCGM list of Field IDs. For your benefit, here we briefly outline the GPU metrics set in this default configuration.The most important of these is the GPU utilization (“DCGM_FI_DEV_GPU_UTIL”). This metric indicates what fraction of time the GPU is not idle. Next is the GPU used memory (“DCGM_FI_DEV_FB_USED”) and it indicates how many GPU memory bytes have been allocated by the workload. This can let you know how much headroom remains on the GPU memory. For an AI workload you can use this to gauge whether you can run a larger model or increase the batch size.The GPU SM utilization (“DCGM_FI_PROF_SM_ACTIVE”) lets you know what fraction of the GPU SM processors are in use during the workload. If this is low, it indicates there is headroom to submit parallel workloads to the GPU. On an AI workload you might send multiple inference requests. Taken together with the SM occupancy (“DCGM_FI_PROF_SM_OCCUPANCY”) it can let you know if the GPUs are being efficiently and fully utilized.The GPU Tensor activity (“DCGM_FI_PROF_PIPE_TENSOR_ACTIVE”) indicates whether your workload is taking advantage of the Tensor Cores on the GPU. The Tensor Cores are specialized IP blocks within an SM processor that enable accelerated matrix multiplication. It can indicate to what extent your workload is bound on dense matrix math.

Read More  Introducing Code Llama, A State-Of-The-Art Large Language Model For Coding

The FP64, FP32, and FP16 activity (e.g. “DCGM_FI_PROF_PIPE_FP64_ACTIVE”) indicates to what extent your workload is exercising the GPU engines targeting a specific precision. A scientific application might skew to FP64 calculations and an ML/AI workload might skew to FP16 calculations.

The GPU NVLink activity (e.g. “DCGM_FI_PROF_NVLINK_TX_BYTES”) indicates the bandwidth (in bytes/sec) of traffic transmitted directly from one GPU to another over high-bandwidth NVLink connections. This can indicate whether the workload requires communicating GPUs; and, if so, what fraction of the time the workload is spending on collective communication.

The GPU PCIe activity (e.g. “DCGM_FI_PROF_PCIE_TX_BYTES“) indicates the bandwidth (in bytes/sec) of traffic transmitted to or from the host system.

All the fields with “_PROF_” in the DCGM field identifier are “profiling metrics.” For a detailed technical description of their meaning take a look at NVIDIA DCGM Profiling Metrics. Note that these do have some limitations for NVIDIA hardware before H100. In particular they cannot be used concurrently with profiling tools like NVIDIA Nsight. You can read more about these limitations at DCGM Features, Profiling Sampling Rate.

2. (Optional:) By default we have configured the scrape interval at 20 sec. You can adjust the period at which NVIDIA DCGM exporter scrapes NVIDIA DCGM and likewise the interval at which GKE Managed Prometheus scrapes the NVIDIA DCGM exporter:

apiVersion: apps/v1
kind: DaemonSet
metadata:
  name: nvidia-dcgm-exporter
…
spec:
…
        args:
        - hostname $NODE_NAME; dcgm-exporter -k --remote-hostengine-info $(NODE_IP) --collectors /etc/dcgm-exporter/counters.csv --collect-interval 20000
…
apiVersion: monitoring.googleapis.com/v1alpha1
kind: PodMonitoring
metadata:
  name: nvidia-dcgm-exporter-gmp-monitor
…
spec:
…
  endpoints:
  - port: metrics
    interval: 20s

Selecting a lower sample period (say 1 sec) will give a high resolution view of the GPU activity and the workload pattern. However selecting a higher sample rate will result in more data being emitted to Cloud Monitoring. This may cause a higher bill from Cloud Monitoring. See “Metrics from Google Cloud Managed Service for Prometheus” on the Cloud Monitoring Pricing page to estimate charges.3. (Optional:) In this example we use NVIDIA DCGM 2.3.5. You can adjust the NVIDIA DCGM version by selecting a different image from the NVIDIA container registry. Note that the NVIDIA DCGM exporter version must be compatible with the NVIDIA DCGM version. So be sure to change both when selecting a different version.
apiVersion: apps/v1
kind: DaemonSet
metadata:
  name: nvidia-dcgm
…
spec:
…
      containers:
      - image: "nvcr.io/nvidia/cloud-native/dcgm:2.3.5-1-ubuntu20.04"
…
apiVersion: apps/v1
kind: DaemonSet
metadata:
  name: nvidia-dcgm-exporter
…
spec:
…
      containers:
      - name: nvidia-dcgm-exporter
        image: nvcr.io/nvidia/k8s/dcgm-exporter:2.3.5-2.6.5-ubuntu20.04

Here we have deployed NVIDIA DCGM and the NVIDIA DCGM Exporter as separate containers. It is possible for the NVIDIA DCGM exporter to launch and run the NVIDIA DCGM process within its own container. For a description of the options available on the DCGM exporter, see the DCGM Exporter page.

Deploying GPU Monitoring System

1. Deploy NVIDIA DCGM + NVIDIA DCGM exporter + Managed Prometheus configuration.

kubectl create namespace gpu-monitoring-system
kubectl apply -f quickstart/dcgm_quickstart.yml

If successful, you should see a privileged NVIDIA DCGM and NVIDIA DCGM exporter pod running on every GPU node.

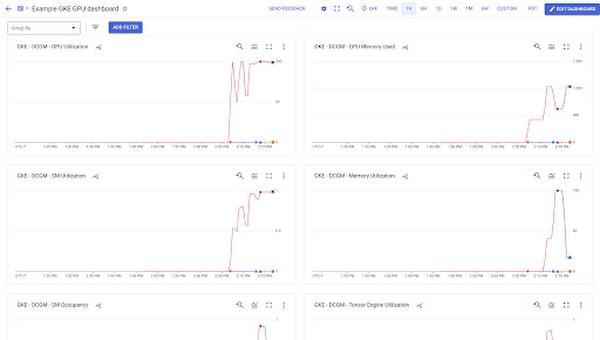
Set up a Cloud Monitoring Dashboard

1. Import a custom dashboard to view DCGM metrics emitted to Managed Prometheus

gcloud monitoring dashboards create \
  --config-from-file quickstart/gke-dcgm-dashboard.yml

2. Navigate to Monitoring Dashboards page of the Cloud Console to view the newly added “Example GKE GPU” dashboard. 
3. For a given panel you can expand the legend to include the following fields:The following fields are available in the legend:
“cluster” (GKE cluster name)
“instance” (GKE node name)
“gpu” (GPU index on the GKE node)
“modelName” (whether NVIDIA T4, V100, A100 etc.)
“exported container” (container that has mapped this GPU)
“exported namespace” (namespace of the container that has mapped this GPU)Because Managed Prometheus monitors the GPU workload through NVIDIA DCGM exporter, it is important to keep in mind that that the container name and namespace are on the labels “exported container” and “exported namespace”

Read More  Google Cloud Infrastructure Enhancements Tailored For Your Workloads

Stress Test your GPUs for Monitoring

We have provided an artificial load so you can observe your GPU metrics in action. Or feel free to deploy your own GPU workloads.

1. Apply an artificial load tester for the NVIDIA GPU metrics.

kubectl apply -f quickstart/dcgm_loadtest.yml

This load test creates a container on a single GPU. It then gradually cycles through all the displayed metrics. Note that the NVLink bandwidth will only be utilized if the VM has two NVIDIA GPUs connected by an NVLink connection.

Set up a Grafana Dashboard

1. Deploy the Prometheus UI frontend, Grafana, and inverse proxy configuration.

cd grafana
sed 's/\$PROJECT_ID/<YOUR PROJECT ID>/' grafana.yml | kubectl apply -f -

<YOUR PROJECT ID> should be replaced with your project ID for the cluster.Wait until the inverse proxy config map is populated with an endpoint for Grafana:
kubectl get configmap inverse-proxy-config -o jsonpath="{.data}" -n gpu-monitoring-system
{
  …
  "Hostname":
  "7b530ae5746e0134-dot-us-central1.pipelines.googleusercontent.com",
  …
}

Copy and paste this URL into your browser to access the Grafana page. Only users with access to the same GCP project will be authorized to visit the Grafana page.The inverse proxy agent deployed to the GKE cluster uses a Docker Hub image hosted at sukha/inverse-proxy-for-grafana. See Building the Inverse Proxy Agent for more info.2. On the Grafana page click “Add your first data source,” then select “Prometheus.” Then fill the following Prometheus configuration: 

Note that the full URL should be
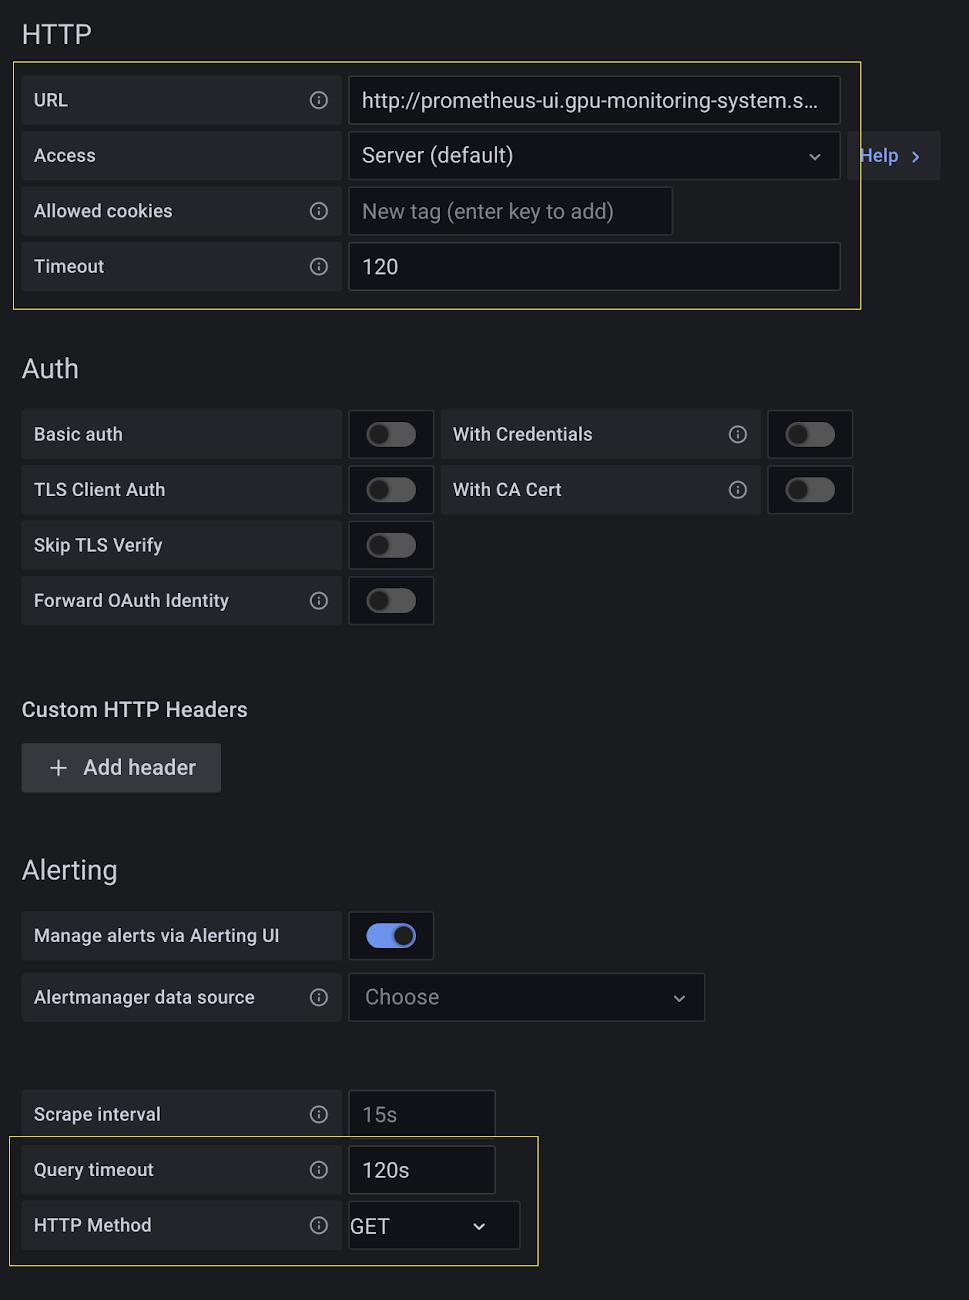
”http://prometheus-ui.gpu-monitoring-system.svc:9090”Select “Save and test” at bottom. You should see “Data source is working.”3. Import the Grafana dashboard by selecting the “Import” from the “+ Create” widget panel on the left-hand side of the Grafana page. 

Then select the local JSON file “grafana/gke-dcgm-grafana-dashboard.json.”

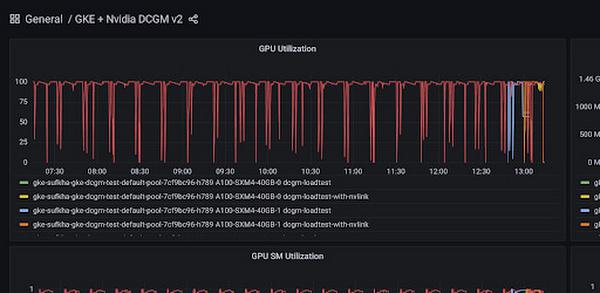
You should see the GPU utilization and all other metrics for the fake workload you deployed earlier. Note that the dashboard is configured to only display metrics whose container label is not the empty string. Therefore it does not display metrics for idle GPUs with no attached containers.


4. You can also explore the available metrics directly from the “Explorer” page. Select the “Explorer” widget along the left-hand panel. Then click “Metrics Browser” to display the list of available metrics and their labels. 
You can use the Metrics Explorer page to explore the available metrics. From this knowledge you can build a custom dashboard based on queries that suit your case.

Conclusion

In this blog you were able to deploy a GKE cluster with NVIDIA GPUs and emit GPU utilization metrics by workload to Cloud Monitoring. We also set up a Cloud Monitoring dashboard to view GPU utilization by workload.

This GPU monitoring system leveraged the NVIDIA Data Center GPU Manager. All of the available NVIDIA DCGM metrics are accessible for monitoring. We also discussed the available GPU metrics and their meaning in the context of application workloads.

Finally we provided a means to deploy an in-cluster Grafana GPU utilization dashboard accessible from a Google hosted endpoint for users with access to the corresponding Google Cloud project.


By: Suffian Khan (Senior Software Engineer, AI+Accelerators Experience) and Tao He (Senior Software Engineer, Google Kubernetes Engine)
Source: Google Cloud Blog


For enquiries, product placements, sponsorships, and collaborations, connect with us at [email protected]. We'd love to hear from you!

Our humans need coffee too! Your support is highly appreciated, thank you!

aster.cloud

Related Topics
  • Artificial Intelligence
  • Containers
  • GKE
  • Google Cloud
  • Google Kubernetes Engine
  • Kubernetes
  • Machine Learning
  • Monitoring
  • NVIDIA
  • Tutorials
You May Also Like
View Post
  • Computing
  • Multi-Cloud
  • Technology

What is cloud bursting?

  • June 18, 2025
View Post
  • Computing
  • Multi-Cloud
  • Technology

What is confidential computing?

  • June 17, 2025
View Post
  • Computing
  • Multi-Cloud
  • Technology

Oracle adds xAI Grok models to OCI

  • June 17, 2025
View Post
  • Computing
  • Multi-Cloud
  • Technology

Fine-tune your storage-as-a-service approach

  • June 16, 2025
View Post
  • Technology

Advanced audio dialog and generation with Gemini 2.5

  • June 15, 2025
View Post
  • Computing
  • Multi-Cloud
  • Technology

Global cloud spending might be booming, but AWS is trailing Microsoft and Google

  • June 13, 2025
View Post
  • Computing
  • Multi-Cloud
  • Technology

Google Cloud, Cloudflare struck by widespread outages

  • June 12, 2025
View Post
  • Computing
  • Multi-Cloud
  • Technology

What is PC as a service (PCaaS)?

  • June 12, 2025

Stay Connected!
LATEST
  • What is cloud bursting?
    • June 18, 2025
  • What is confidential computing?
    • June 17, 2025
  • Oracle adds xAI Grok models to OCI
    • June 17, 2025
  • Fine-tune your storage-as-a-service approach
    • June 16, 2025
  • 5
    Advanced audio dialog and generation with Gemini 2.5
    • June 15, 2025
  • 6
    A Father’s Day Gift for Every Pop and Papa
    • June 13, 2025
  • 7
    Global cloud spending might be booming, but AWS is trailing Microsoft and Google
    • June 13, 2025
  • Google Cloud, Cloudflare struck by widespread outages
    • June 12, 2025
  • What is PC as a service (PCaaS)?
    • June 12, 2025
  • 10
    Apple services deliver powerful features and intelligent updates to users this autumn
    • June 11, 2025
about
Hello World!

We are aster.cloud. We’re created by programmers for programmers.

Our site aims to provide guides, programming tips, reviews, and interesting materials for tech people and those who want to learn in general.

We would like to hear from you.

If you have any feedback, enquiries, or sponsorship request, kindly reach out to us at:

[email protected]
Most Popular
  • 1
    Crayon targets mid-market gains with expanded Google Cloud partnership
    • June 10, 2025
  • By the numbers: Use AI to fill the IT skills gap
    • June 11, 2025
  • 3
    Apple supercharges its tools and technologies for developers to foster creativity, innovation, and design
    • June 9, 2025
  • Apple-WWDC25-Apple-Intelligence-hero-250609 4
    Apple Intelligence gets even more powerful with new capabilities across Apple devices
    • June 9, 2025
  • Apple-WWDC25-Liquid-Glass-hero-250609_big.jpg.large_2x 5
    Apple introduces a delightful and elegant new software design
    • June 9, 2025
  • /
  • Technology
  • Tools
  • About
  • Contact Us

Input your search keywords and press Enter.