aster.cloud aster.cloud
  • /
  • Platforms
    • Public Cloud
    • On-Premise
    • Hybrid Cloud
    • Data
  • Architecture
    • Design
    • Solutions
    • Enterprise
  • Engineering
    • Automation
    • Software Engineering
    • Project Management
    • DevOps
  • Programming
    • Learning
  • Tools
  • About
  • /
  • Platforms
    • Public Cloud
    • On-Premise
    • Hybrid Cloud
    • Data
  • Architecture
    • Design
    • Solutions
    • Enterprise
  • Engineering
    • Automation
    • Software Engineering
    • Project Management
    • DevOps
  • Programming
    • Learning
  • Tools
  • About
aster.cloud aster.cloud
  • /
  • Platforms
    • Public Cloud
    • On-Premise
    • Hybrid Cloud
    • Data
  • Architecture
    • Design
    • Solutions
    • Enterprise
  • Engineering
    • Automation
    • Software Engineering
    • Project Management
    • DevOps
  • Programming
    • Learning
  • Tools
  • About
  • Public Cloud

Richer Data Visualization On Google Maps Platform Using deck.gl

  • aster.cloud
  • October 12, 2021
  • 4 minute read

Today at Google Cloud Next, we are showcasing the release of the newest open source data visualization library deck.gl version 8.6. Thanks to a close collaboration between our friends at the location intelligence platform CARTO, the vis.gl Technical Steering Committee (TSC), and teams from Google Maps Platform and Google Cloud, this release adds deep integration of deck.gl with the WebGL Overlay View feature of the Maps JavaScript API. Now you can take advantage of the wide variety of beautiful, insightful 2D and 3D visualizations offered by deck.gl to create a new level of mapping experiences with your data.

deck.gl Examples
Examples of different visualizations made possible by the deck.gl/WebGL Overlay View integration.

These new types of visualizations can be used to address any geospatial use case. To show the powerful capabilities of deck.gl with the Maps JavaScript API, the team at CARTO created an example app that visualizes a variety of data sources that show the potential for electrification of truck fleets in Texas. This example showcases how CARTO uses deck.gl and our WebGL-powered maps features tools to bring Texas’ area and population sizes to life, using fully interactive map visualizations.


Partner with aster.cloud
for your next big idea.
Let us know here.


From our partners:

CITI.IO :: Business. Institutions. Society. Global Political Economy.
CYBERPOGO.COM :: For the Arts, Sciences, and Technology.
DADAHACKS.COM :: Parenting For The Rest Of Us.
ZEDISTA.COM :: Entertainment. Sports. Culture. Escape.
TAKUMAKU.COM :: For The Hearth And Home.
ASTER.CLOUD :: From The Cloud And Beyond.
LIWAIWAI.COM :: Intelligence, Inside and Outside.
GLOBALCLOUDPLATFORMS.COM :: For The World's Computing Needs.
FIREGULAMAN.COM :: For The Fire In The Belly Of The Coder.
ASTERCASTER.COM :: Supra Astra. Beyond The Stars.
BARTDAY.COM :: Prosperity For Everyone.

Carto demo Page
CARTO’s story map uses deck.gl to visualize the potential for electrification of truck fleets in Texas.

How does deck.gl work with the Maps JavaScript API?

Deck.gl has supported the raster basemap offered by the Maps JavaScript API for a while. This new release adds support for the vector basemap in interleaved mode. This means that with deck.gl, Google’s vector map can now be mixed with data layers, providing a pixel perfect composition where labels, 3D, and other content is respected and rendered perfectly with depth and occlusion.

Under the hood this means that the vector basemap and deck.gl share the same WebGL rendering context, increasing the performance and flexibility of visualizations rendered on the map. In effect, instead of the visualizations of deck.gl being rendered on the map, they are now rendered as part of the map. Sharing this WebGL context is not easy, so our team and the CARTO team have partnered to provide support as both libraries evolve.

Read More  Set Your 2021 API Resolutions With These Top 2020 Posts

Let’s take a look at an example.

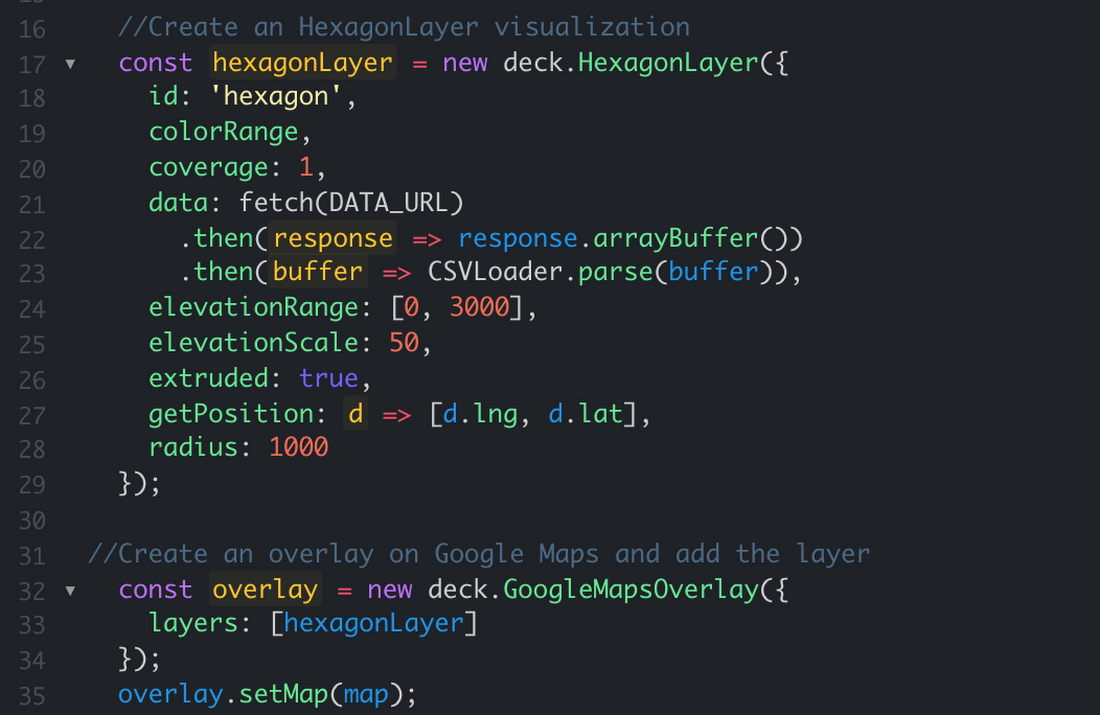
In the following code, we are loading data from a CSV file using the open source library loaders.gl, creating a Hexagon deck.gl visualization layer, creating an overlay for Google Maps Platform, and finally adding it to the map.

deckgl code example
Code for a simple deck.gl Hexagon Layer visualization.
UK image rendered
The Hexagon Layer visualization from the code above, applied to the map of the United Kingdom.

Advanced visualization capabilities

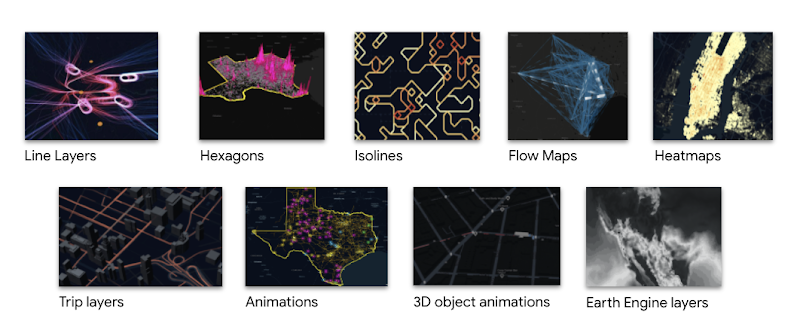
Deck.gl offers a very flexible framework for creating or utilizing existing visualizations. Check out the examples on the deck.gl website and CARTO’s gallery of demos to get some inspiration.

Gallery of Demos
Check out the gallery of demos.

With the flexibility of deck.gl, of course you can go quite a long way, as showcased in CARTO’s Texas demo. Let’s take a look at some of the main visualizations.
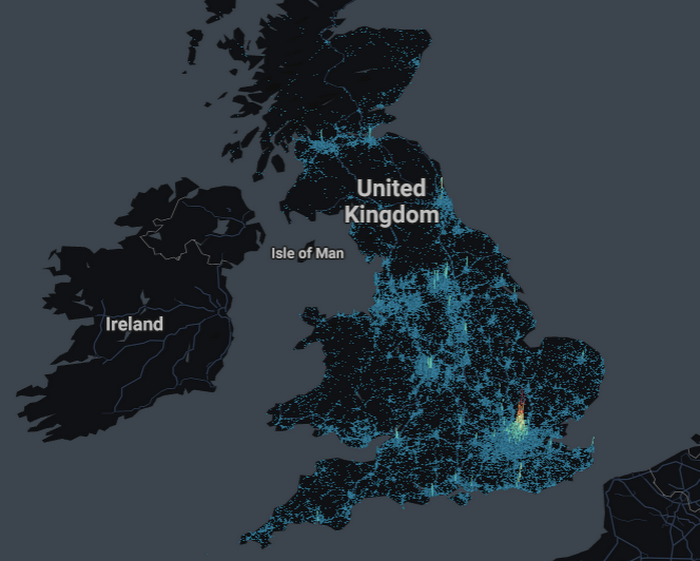
Hexagon Layer

The Hexagon layer is useful for visualizing aggregated data. You can define the colors or the height of the hexagons, using a property such as population. In this example, you can see how the population of Texas is concentrated in a few large urban areas.

deckgl hexagon example
The population density of Texas, shown using a Hexagon Layer visualization.

Map Large datasets using Vector Tiles

When visualizing large datasets, like in the case of the power line visualizations. You are going to need to load the data progressively in tiles. Deck.gl has different pre-created layers like MVTLayer, TileLayer or  Tile3DLayer.

deckgl transmission lines
Electrical transmission lines across Texas, shown using a Tile3DLayer visualization.

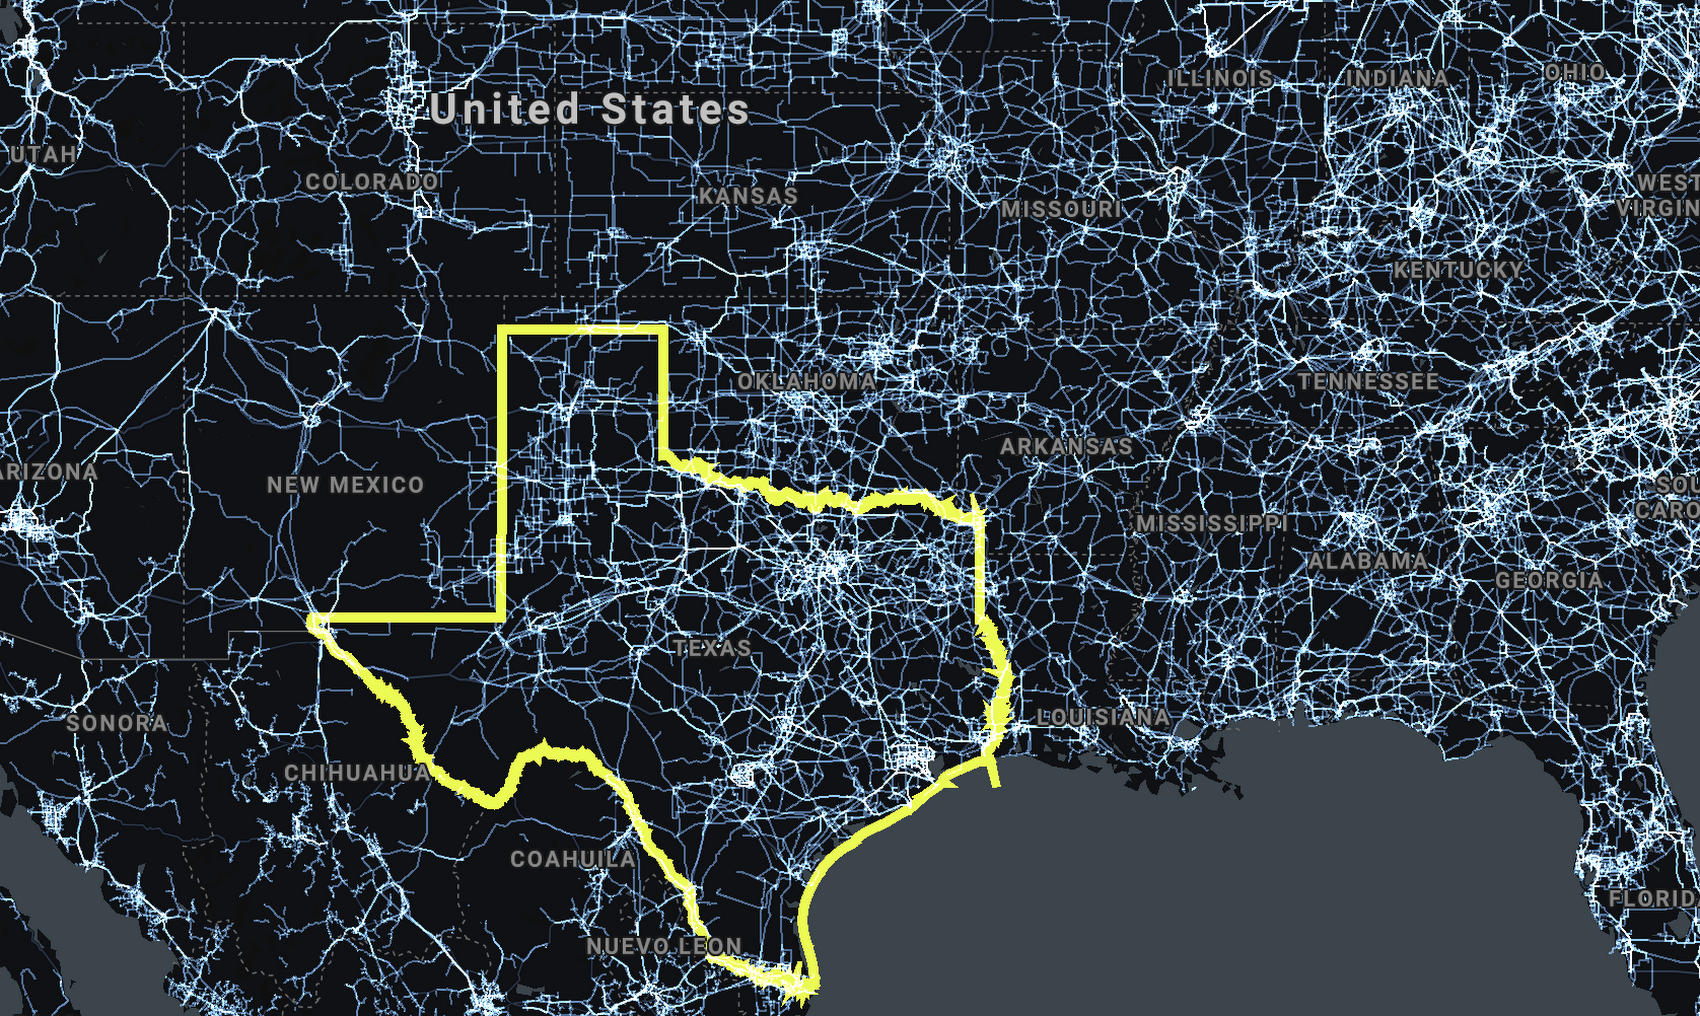
In this map we are visualizing an open dataset of around 70MB of electric power lines. Using the CartoLayer on deck.gl, this visualization loads the data in small vector tiles of less than 512kb.

Animations and rich cartography

In addition to cartographic capabilities, animation features allow for a much richer set of visualizations and a seamless user experience. The example below shows Texas’ renewable energy sources.

Read More  How Tens Of Thousands Of Japanese Found Their Way To COVID-19 Vaccination Centers With The Help Of Navagis And Google Maps Platform
deckgl animations 1
Support for animations and transitions brings an even richer experience to data visualization.
deckgl animations 2
Support for animations and transitions brings an even richer experience to data visualization.

Animating trips and 3D

Animating trips is one of the most popular deck.gl visualizations. And because of the interleaving support, those trips respect buildings and all other Google Maps Platform features.

deckgl trips
TripsLayer allows you to visualize data in motion over time.
deckgl trips 2
TripsLayer allows you to visualize data in motion over time.

Check out the code here.
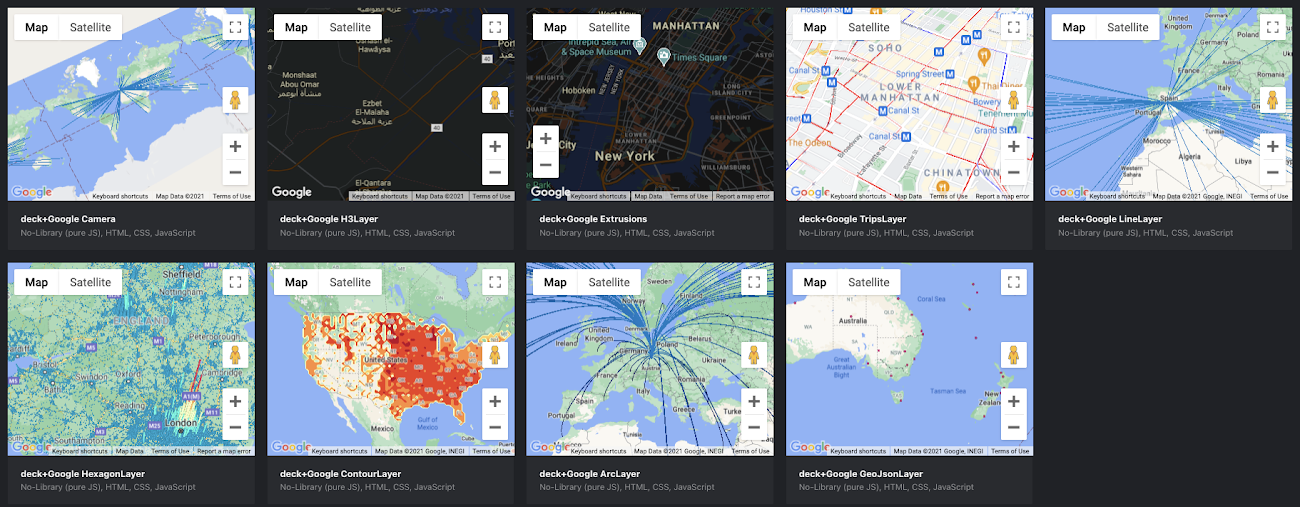
Try it out

To get started, take a look at some of the demos of deckgl + Google Maps Platform. Then head to deck.gl website to learn more in advance on how to customize the layers or even create your own ones. Finally the entire source code for the Texas demo is also freely available.

We hope you have fun mixing deck.gl and Google Maps Platform—we can’t wait to see what interesting visualizations you build. For more information on CARTO, getting a free account, and overlaying data from BigQuery, visit the CARTO website.

For more information on Google Maps Platform, visit our website.

By Travis McPhail Software Engineer, Google Maps Platform
Source Google Cloud Blog

For enquiries, product placements, sponsorships, and collaborations, connect with us at [email protected]. We'd love to hear from you!

Our humans need coffee too! Your support is highly appreciated, thank you!

aster.cloud

Related Topics
  • deck.gl
  • Google Cloud
  • Google Maps
You May Also Like
View Post
  • Computing
  • Public Cloud
  • Technology

United States Army Enterprise Cloud Management Agency Expands its Oracle Defense Cloud Services

  • April 15, 2025
DeepSeek R1 is now available on Azure AI Foundry and GitHub
View Post
  • Public Cloud
  • Technology

DeepSeek R1 is now available on Azure AI Foundry and GitHub

  • February 2, 2025
Cloud platforms among the clouds
View Post
  • Computing
  • Learning
  • Public Cloud

Best Cloud Platforms Offering Free Trials for Cloud Mastery

  • December 23, 2024
Vehicle Manufacturing
View Post
  • Hybrid Cloud
  • Public Cloud

Toyota shifts into overdrive: Developing an AI platform for enhanced manufacturing efficiency

  • December 10, 2024
IBM and AWS
View Post
  • Public Cloud

IBM and AWS Accelerate Partnership to Scale Responsible Generative AI

  • December 2, 2024
COP29 AI and Climate Change
View Post
  • Public Cloud
  • Technology

How Cloud And AI Are Bringing Scale To Corporate Climate Mitigation And Adaptation

  • November 18, 2024
Cloud Workstations
View Post
  • Public Cloud

FEDRAMP High Development in the Cloud: Code with Cloud Workstations

  • November 8, 2024
View Post
  • Public Cloud

PyTorch/XLA 2.5: vLLM support and an improved developer experience

  • October 31, 2024

Stay Connected!
LATEST
  • 1
    Pure Accelerate 2025: All the news and updates live from Las Vegas
    • June 18, 2025
  • 2
    ‘This was a very purposeful strategy’: Pure Storage unveils Enterprise Data Cloud in bid to unify data storage, management
    • June 18, 2025
  • What is cloud bursting?
    • June 18, 2025
  • 4
    There’s a ‘cloud reset’ underway, and VMware Cloud Foundation 9.0 is a chance for Broadcom to pounce on it
    • June 17, 2025
  • What is confidential computing?
    • June 17, 2025
  • Oracle adds xAI Grok models to OCI
    • June 17, 2025
  • Fine-tune your storage-as-a-service approach
    • June 16, 2025
  • 8
    Advanced audio dialog and generation with Gemini 2.5
    • June 15, 2025
  • 9
    A Father’s Day Gift for Every Pop and Papa
    • June 13, 2025
  • 10
    Global cloud spending might be booming, but AWS is trailing Microsoft and Google
    • June 13, 2025
about
Hello World!

We are aster.cloud. We’re created by programmers for programmers.

Our site aims to provide guides, programming tips, reviews, and interesting materials for tech people and those who want to learn in general.

We would like to hear from you.

If you have any feedback, enquiries, or sponsorship request, kindly reach out to us at:

[email protected]
Most Popular
  • Google Cloud, Cloudflare struck by widespread outages
    • June 12, 2025
  • What is PC as a service (PCaaS)?
    • June 12, 2025
  • 3
    Crayon targets mid-market gains with expanded Google Cloud partnership
    • June 10, 2025
  • By the numbers: Use AI to fill the IT skills gap
    • June 11, 2025
  • 5
    Apple services deliver powerful features and intelligent updates to users this autumn
    • June 11, 2025
  • /
  • Technology
  • Tools
  • About
  • Contact Us

Input your search keywords and press Enter.