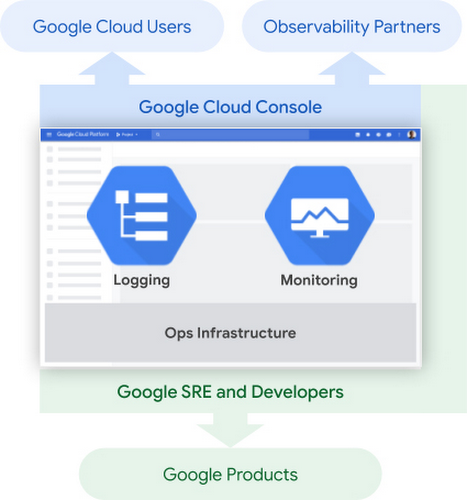
We’ve heard from customers about how important it is to be able to reliably operate your applications and infrastructure running on Google Cloud. In particular, observability is critical to reliable operations. To help you quickly gain insight into your Google Cloud environment, we’ve added 21 new features to Cloud Operations, the observability suite we launched earlier this year, which gives you access to all our operations capabilities directly from the Google Cloud Console. The new features we’re discussing today make it easier for you to get the observability you need from your environment, whether it’s in Google Cloud, other clouds, on-premises or a mix.
Perhaps more importantly, Cloud Operations is built on top of infrastructure with breathtaking scale—and we pass the resulting performance on to you. Two of Cloud Operations’ central services, Cloud Monitoring and Cloud Logging, are built on core observability platforms used by all of Google that handle over 16 million metrics queries per second, 2.5 exabytes of logs per month, and over 14 quadrillion metric points on disk. That’s a lot of data!
From our partners:
To get to this scale, we developed the culture and practices that go into building, launching and running production applications with high velocity and reliability. The practice of Site Reliability Engineering (SRE) is core to this, and an integral part of product planning. In addition to offering the power of this massive platform to Google Cloud customers, we’ve been picking relevant capabilities from the SRE approach that we believe will simplify customer experiences, and building them into Cloud Ops products, broken down according to the five steps of the process for adding observability in your environment—plan, collect, store, configure and troubleshoot. Let’s take a closer look.
Plan
Before you start building your operational workflow, it’s a best practice to outline your services and how you want each to perform, defining Service Level Objectives, (SLOs). That leads us to our first new feature:
1. The general availability of SLO Monitoring
Now, focusing on your SLOs is easier than ever. SLO Monitoring gives you the ability to focus on signals and improve the signal-to-noise ratio. This, along with out-of-the-box alerts, reduces the levels of expertise required to monitor production environments, and makes it easier to identify and remediate issues before they impact critical business metrics.
In just two weeks since making it generally available, we’ve had hundreds of new users for SLO Monitoring, and gotten some great feedback about how it can simplify your monitoring practices.
“SLOs measure how the user feels about your product—that is what truly matters,” said Vipul Makar, SRE Lead & Enterprise Architect, Equifax. “With SLO Monitoring we make data-driven decisions and build more reliable products. Once we learned how to use SLOs we never looked back!”
To learn more about SLOs and using custom metrics to create SLOs, join us at these Google Cloud Next ’20: OnAir sessions: OPS200 – Kubernetes Engine Infrastructure and Service Monitoring with Equifax and OPS102 – Best Practices for Custom Metric Telemetry on Google Cloud.
Collect
Collecting logs and metrics is easy when you leverage out-of-the-box observability for Google Cloud system logs and metrics. You can add application and third-party logs and metrics from wherever they are generated: OpenTelemetry / OpenCensus, captured by Google Cloud monitoring and logging agents, or submitted directly through Cloud Operations APIs.
Today, we’re expanding the types of logs that you can use in Logging in two important ways:
2. G Suite audit logs – The integration between G Suite audit logs and Cloud Logging is now generally available, adding to the dozens of Google Cloud services already providing audit logs out of the box.
3. Multi-cloud and on premise – We’ve partnered with Blue Medora to provide agents for collecting logs and metrics from anywhere — now generally available at no additional cost.
We’ve also made it even easier to capture metrics and logs from your Compute Engine VMs:
4. You can now install, run, and manage the Cloud Logging and Monitoring agents across groups of Compute Engine instances or your entire fleet with a single command.
To learn more about collecting logs and metrics, join us at OPS102 – Best Practices for Custom Metric Telemetry on Google Cloud and OPS203 – OpenTelemetry and Observability at Shopify, Splunk, and Google.
Store
Being able to store and protect your data in Cloud Logging and Monitoring is critical to your observability strategy. That’s why we’ve been working hard to launch new features to help you meet your security and privacy requirements.
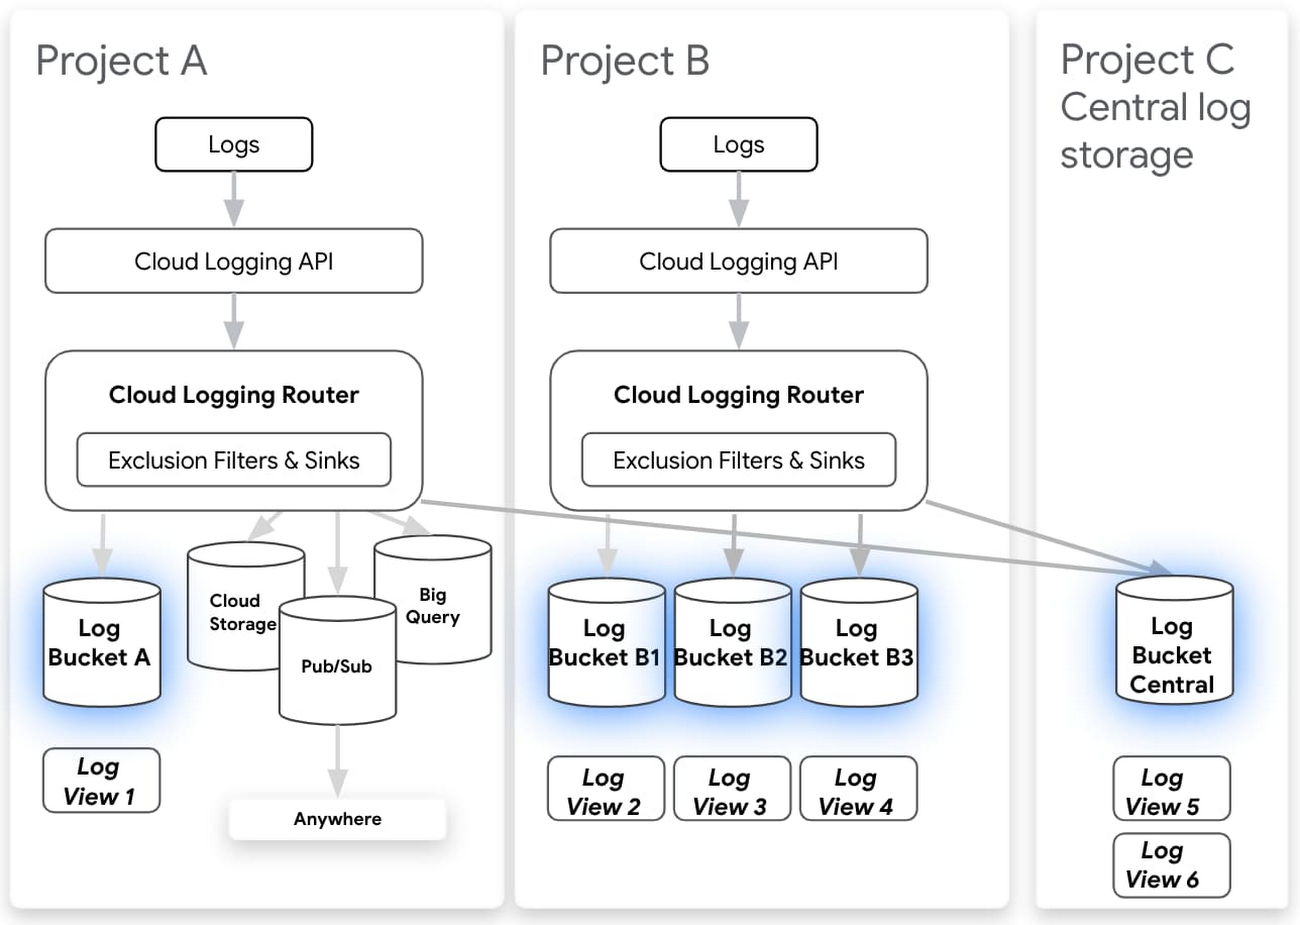
Cloud Logging makes it easy to search and analyze logs as well as provides a central, secure, compliant, and scalable log storage solution. Today we’re announcing a number of improvements to log storage and management building on several recent improvements for exploring and analyzing logs. Here’s a selection of what’s new:
5. Logs buckets (Beta) – Centralize or subdivide your logs based on your needs for ownership, retention, and region.
6. Logs views (Preview) – Gain better control over who has access to your logs data.
7. Regionalized log storage (Preview) – Configure your log buckets in five separate cloud regions, with more to come.
8. Improved log routing (Preview) – Route logs from one project to another or even using an aggregated log sink at the folder or organization level to centralize logs into a logs bucket.
9. Customizable retention (Generally Available) – In addition to announcing that custom retention is generally available, allowing you to retain your logs data for anywhere from one day to 10 years, you can now use custom retention through the end of March 2021 for no additional cost. This means you can try out our log management capabilities for your long-term compliance and analytics needs for logs without a cost commitment.
Regionalized logs buckets and logs views are now in private preview but coming to beta in September 2020. Some examples of our new functionality that preview users have enjoyed include centralizing all audit logs from across your organization, splitting out logs from a multitenant GKE cluster into multiple projects, or setting up regionalized log storage. Sign up for access or to be notified of future releases of the preview of logs views and regionalized storage.
Then, there’s your ability to write and retain custom and Prometheus metrics, which can be critical to the observability of your applications and services. To help ensure that you have these metrics when you need them:
10. Extended Retention for Custom and Prometheus metrics – they are now retained for 24 months rather than 6 weeks, at no additional cost.
11. 10 second resolution for Agent, Custom, and Prometheus metrics – you can write metrics at 10 second granularity for agent, custom and Prometheus metrics. You can use these higher resolution metrics to track rapidly changing environments, applications, services, and infrastructure.
To learn more about our new log management capabilities, join us at OPS100 – Designing for Observability on Google Cloud.
Configure
Our Cloud Operations suite offers several ways for you to customize your environment to meet your business and reliability goals: dashboards, alerting policies, logs-based metrics, uptime checks and SLOs. We’ve got a range of new improvements to help you both automate your configuration and get started quickly with new out of the box dashboards.
12. Monitoring Dashboards API – Building out your dashboards at scale is easier than ever with our new Dashboards API, which allows you to manage your monitoring as code.
13. Out of the box dashboards – The only thing better than easy-to-build dashboards are dashboards that are already built for you. We’ve added a range of new out-of-the-box dashboards including a Cloud Logging dashboard and a newly refreshed dashboard for Compute Engine that shows cross-fleet metrics.
14. Pub/Sub alerting notifications – In addition to visualizing your system, you’ll want to use alerting for reliability and automation to reduce toil with the new Pub/Sub integration for alerting in Cloud Monitoring.
15. Monitoring Query Language (generally available) – The new Monitoring Query Language allows you to manipulate time series to create useful charts, for example plot ratios between different metrics or current vs. past metrics, define arithmetic expressions over time-series values, or create new aggregations.
To learn more about alerting and dashboarding with Cloud Operations, join us at OPS208 – Alerting Best Practices for Google Cloud Monitoring and OPS302 – Monitoring as Code.
Troubleshoot
Now that you’ve got everything set up, you’re ready to troubleshoot issues in production. We’ve added six new features to the Cloud Logging to help you find issues fast.
16. Our new logs viewer is now generally available (GA) and boasts a variety of new features for analyzing logs data, and now supports viewing your logs at the folder or org level in your GCP organization.
17. We’ve added histograms to the new logs viewer to help you spot patterns in your logs over time.
18. We’ve added the logs field explorer to the new logs viewer which helps you rapidly refine queries and spot interesting distributions across your data.
19. Saved and recent searches in the new logs viewer to help you get to your most valuable logs more quickly.
20. Integration with traces now provides in-context insight about latency and makes it easy to find all logs that include a specific trace.
21. Our logging query language also got a major upgrade with support for regular expressions.
To learn more about troubleshooting with Cloud Operations, join us at OPS201 – Creating a Better Developer Experience with Google Cloud’s Operations Suite of Products and OPS301 – Analyzing Distributed Traces to Find Performance Bottlenecks.
For an overview of the new functionality and how it can be used with GKE, check out this short video:
Get started with Cloud Operations
With a Google-scale foundation, and an aggressive roadmap of new features and functionality, you can rely on the observability tools in Cloud Operations to help you manage, monitor and troubleshoot your most mission-critical applications. To learn more about Cloud Operations, register for and join us at these NEXT’20 OnAir sessions:
For enquiries, product placements, sponsorships, and collaborations, connect with us at [email protected]. We'd love to hear from you!
Our humans need coffee too! Your support is highly appreciated, thank you!