LitmusChaos is a CNCF sandbox project. Its mission is to help Kubernetes SREs and developers to find weaknesses in Kubernetes platform and applications running on Kubernetes by providing a complete Chaos Engineering framework and associated chaos experiments. In this article, we will discuss
- Why is resilience important for Kubernetes?
- How to achieve it using Litmus?
State of Kubernetes
Thanks to Kubernetes and the ecosystem built by CNCF, common API for microservices orchestration has been a reality for developers. Kubernetes is believed to have crossed the chasm in terms of the technology adoption cycle. As the adoption continues to increase, we need more tools to ensure the adoption process of Kubernetes is seamless and stable. One area that Kubernetes developers and SREs need to focus on is Resilience. As an SRE, how do I make sure that my application is resilient against possible failures? What is the process in which I can tackle Resilience? These are the questions to which we try to provide answers in this article.
From our partners:
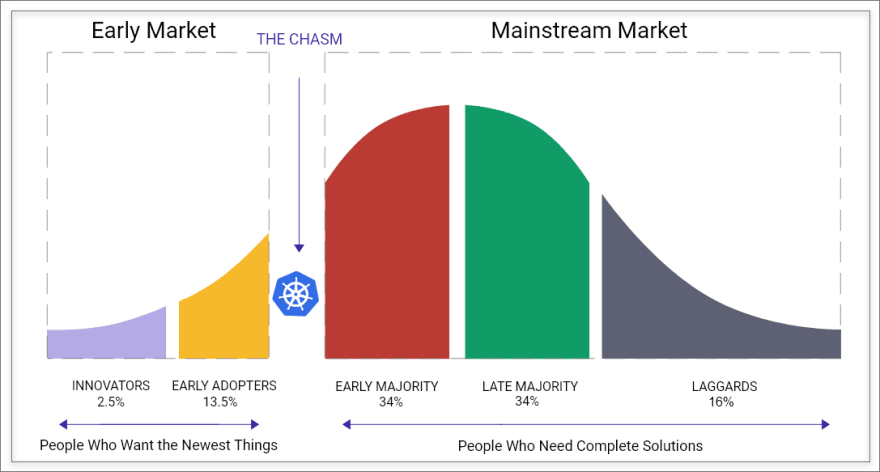
** Kubernetes needs tools and infrastructure to validate the resilience of the platform and applications running on the platform. **
Definition of Resilience
Resilience is the system’s ability to stay afloat when a fault occurs. Staying afloat means different things to different people under different circumstances. Whoever is looking at resilience will usually have a steady-state hypothesis for their system. If that steady state is regained after a fault occurs, then the system is said to be resilient against that fault. Again many types of defects can occur, and they can happen in any sequence. Though you would want your system to be resilient against all faults individually or a combination of these faults all the time, it is practical to assume that it is far fetched. No system is 100% resilient.
In the context of Kubernetes, resilience is even more important because Kubernetes architecture works on the principle of reconciling to the desired state. The state of a resource inside Kubernetes can be changed by Kubernetes itself or by external means.
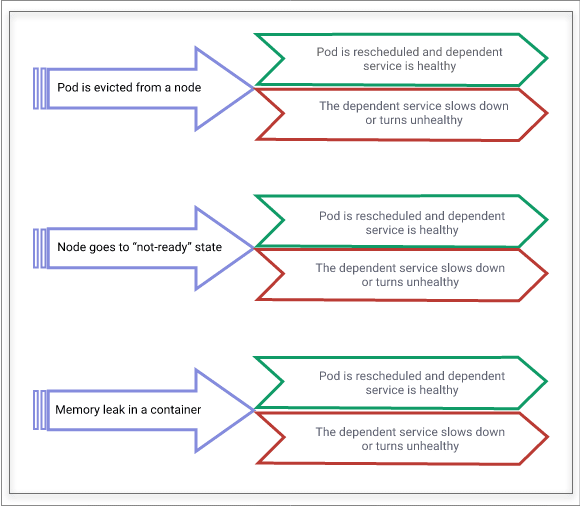
Some examples of general faults on Kubernetes are shown below. Pod evictions, nodes going to “not-ready” state are not uncommon in Kubernetes environments, but the steady-state hypothesis varies widely depending on where you look inside Kubernetes. If a pod is evicted and is rescheduled quickly on another node, then Kubernetes is resilient. Still, if the service that depends on this pod goes down or becomes slow, then that service is not resilient against pod eviction failure. In summary, Resilience is context-sensitive and improving it needs to be looked at as a practice rather than a specific set of tasks.
Importance of Resilience
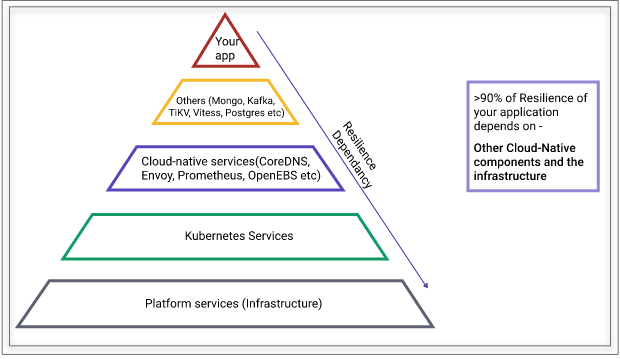
The above diagram shows the dependency stack of resilience for you
r application. At the bottom of the dependency, the stack is the physical infrastructure. Kubernetes is being run on a variety of infrastructure, ranging from virtual machines to bare metal and a combination of them. The platform’s physical nature is a source of faults to the application that runs inside containers, as shown in the tip of the above diagram. The next layer of dependency is Kubernetes itself. Gone are the days, when the platform software like Linux changes once in a year, but expect Kubernetes upgrades every quarter at least for the next few years. Each upgrade has to be considered for careful testing to ensure that the upgraded software is solving the expected problem and not introducing any breaking scenarios. On top of Kubernetes, you have other services like CoreDNS, Envoy, Istio, Prometheus, databases, middleware, etc., which are necessary for your functioning of cloud-native environments. These cloud-native services also go through frequent upgrades.
If you look at the above facts, your application resilience really depends more on the underlying stack than your application itself. It is possible that once your application is stabilized, the resilience of your service that runs on Kubernetes depends on other components and infrastructure more than 90% of the time.
Thus it is important to verify your application resilience whenever a change has happened in the underlying stack. “Keep verifying” is the key. Robust testing before upgrades is not good enough, mainly because you cannot possibly consider all sorts of faults during upgrade testing. This introduces the concept of chaos engineering. The process of “continuously verifying if your service is resilient against faults” is called chaos engineering. For the reasons stated above, overall stack resilience has to be achieved, and chaos engineering against the entire stack must be practiced.
Achieving Resilience on Kubernetes
Achieving resilience requires the practice of Chaos Engineering. SRE teams are prioritizing the practice of chaos engineering at the early stage of their move to Kubernetes. It is also known as the “Chaos First” principle per Adrian Cockrift.https://platform.twitter.com/embed/index.html?dnt=false&embedId=twitter-widget-0&frame=false&hideCard=false&hideThread=false&id=1201703004014907392&lang=en&origin=https%3A%2F%2Fdev.to%2Fumamukkara%2Fintroduction-to-litmuschaos-4ibl&theme=light&widgetsVersion=223fc1c4%3A1596143124634&width=550px
Chaos engineering is more practice and religion than a few tasks or steps. But the fundamental block remains the following.
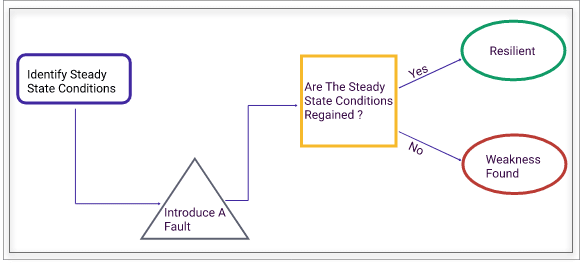
If this practice has to be adopted as a natural choice by SREs on Kubernetes, it must be done in a cloud-native way. The basic principle of being cloud-native is being declarative. Doing chaos engineering openly, declaratively, and keeping the community in mind are some of the principles of “Cloud-Native Chaos Engineering. I had covered this topic in detail in a previous post here.
In summary, in cloud-native chaos engineering, you will have a set of chaos CRDs, and chaos experiments are available as custom resources. Chaos is managed using well known declarative APIs.
Litmus Project introduction
Litmus is a chaos engineering framework for Kubernetes. It provides a complete set of tools required by Kubernetes developers and SREs to carry out chaos tests easily and in Kubernetes-native way. The project has “Declarative Chaos” as the fundamental design goal and keeps the community at the center for growing the chaos experiments.
Litmus has the following components:
Chaos Operator
This operator is built using the Operator SDK framework and manages the lifecycle of a chaos experiment.
Chaos CRDs
Primarily, there are three chaos CRDs – ChaosEngine, ChaosExperiment, and ChaosResult. Chaos is built, run, and managed using the above CRDs. ChaosEngine CRD ties the target application and ChaosExperiment CRs. When run by the operator, the result will be stored in ChaosResult CR.
Chaos experiments or the ChaosHub
Chaos experiments are the custom resources on Kubernetes. The YAML specifications for these custom resources are hosted at the public ChaosHub (https://hub.litmuschaos.io).
Chaos Scheduler
Chaos scheduler supports the granular scheduling of chaos experiments.
Chaos metrics exporter
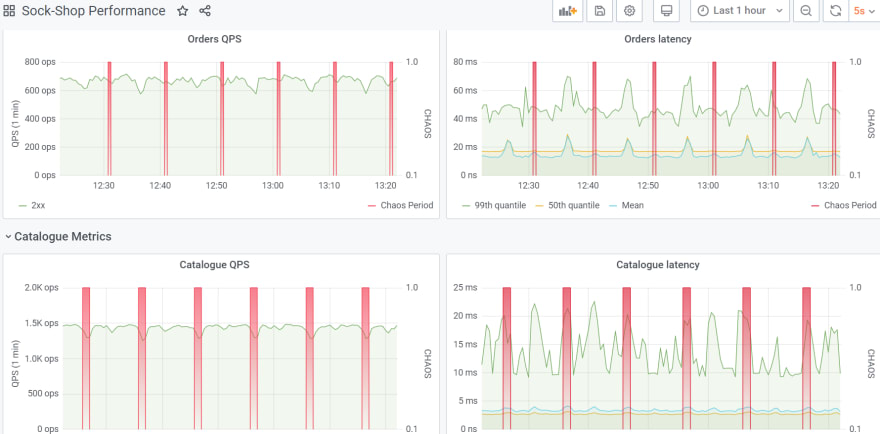
This is a Prometheus metrics exporter. Chaos metrics such as the number, type of experiments, and their results are exported into Prometheus. These metrics and target application metrics are combined to plot graphs that can show the effect of chaos to the application service or performance.
Chaos events exporter
Litmus generates a chaos event for every chaos action that it takes. These chaos events are stored in etcd, and later exported to an event receiver for doing correlation or debugging of a service affected by chaos injection.
Portal
Litmus Portal is a centralized web portal for creating, scheduling, and monitoring chaos workflows. A chaos workflow is a set of chaos experiments. Chaos workflows can be scheduled on remote Kubernetes clusters from the portal. SRE teams can share the portal while managing chaos through the portal.
Note: Litmus Portal is currently under development.
Litmus use cases
Chaos tests can be done anywhere in the DevOps cycle. The extent of chaos tests varies from CI pipelines to production. In development pipelines, you might use chaos tests specific to applications being developed. As you move towards operations or production, you will expect a lot of failure scenarios for which you want to be resilient against, hence the number of chaos tests grows significantly.
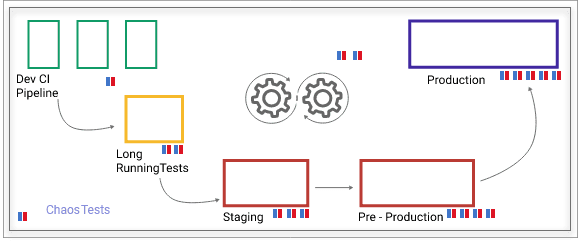
Typical use cases of Litmus include – failure or chaos testing in CI pipelines, increased chaos testing in staging and production and production environments, Kubernetes upgrades certification, post-upgrade validation of services, and resilience benchmarking, etc.
We keep hearing from SREs that they typically see a lot of resistance for introducing chaos from both developers and management. In the practice of chaos engineering, starting with small chaos tests and showing the benefits to developers and management will result in the initially required credibility. With time, the number of tests and associated resilience also will increase.
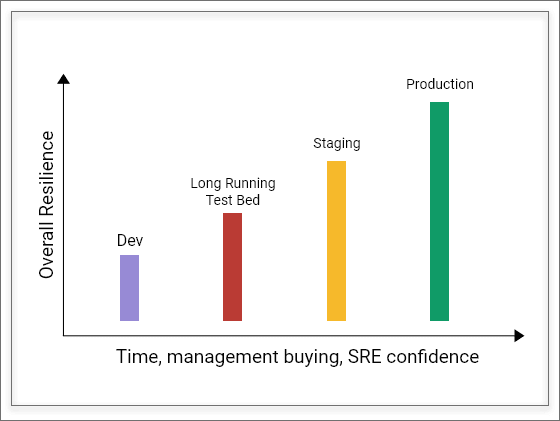
Chaos Engineering is a practice. As seen above, with time, management buying and the SRE confidence will increase, and they move the chaos tests into production. This process will increase resilience metrics, as well.
Litmus architecture
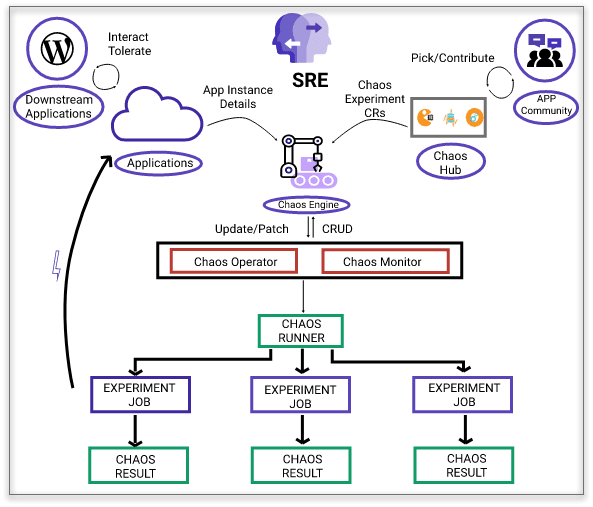
Litmus architecture considers declarative chaos and scalability of chaos as two important design goals. Chaos Operator watches for changes to ChaosEngine CRs and spins off a chaos experiment job with each experiment on a target. Multiple chaos jobs can be run in parallel. The results are stored conveniently as a CR. So, you don’t need to worry about tracking the experiment for a result. They are always available in Kubernetes etcd database. Chaos metrics scraper is also a deployment that scrapes the chaos metrics from ChaosEngine and ChaosResult CRs in etcd database. The above diagram of Litmus chaos execution in one cluster.
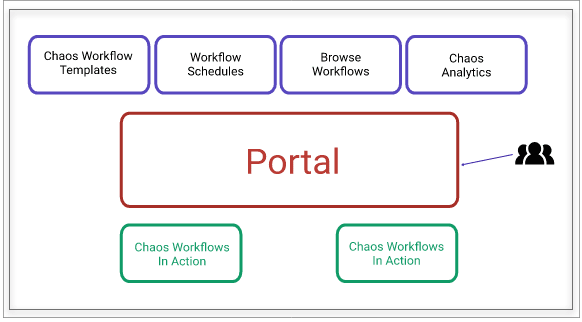
For scalability and deeper chaos, a set of chaos experiments are put together into a workflow, and they are executed through argo workflow. The construction and management of chaos workflows are done at the Litmus portal and run on the target Kubernetes cluster. Portal also includes intuitive chaos analytics. Portal also provides an easy experience for teams to develop new chaos experiments through a private chaoshub called myhub.
Security considerations
Chaos is disruptive by design. One needs to be careful about who can introduce chaos and where. Litmus provides various configurations to control the chaos through policies. Some of them are:
- Annotations: Annotations can be enabled at the application level. When they are enabled, which is the setting by default, the target application needs to be annotated with “chaos=true”
- ServiceAccounts: RBACs are configurable at each experiment level. Each experiment may require different permissions based on the type of chaos being introduced.
However, Litmus can also be run in Admin mode where chaos experiments themselves are run in the Litmus namespace, and there is a service account with admin privileges attached to litmus. This mode is recommended only if you are running Litmus for learning purposes or pure dev environments. It is advised to run Litmus in namespace mode in staging and production environments.
Anatomy of a chaos experiment
A chaos experiment in Litmus is designed to be flexible and expandable. Some of the tunables are:
- Chaos parameters like chaos interval, frequency
- Chaos library itself. Sometimes it is possible that different chaos libraries can do a particular chaos action. You can choose a library of your choice at that time. For example, Litmus supports Native-Litmus, PowerfulSeal, and ChaosToolkit for doing a pod-delete. This model allows you to use Litmus framework if you have already been using some chaos and make use of them as they are.
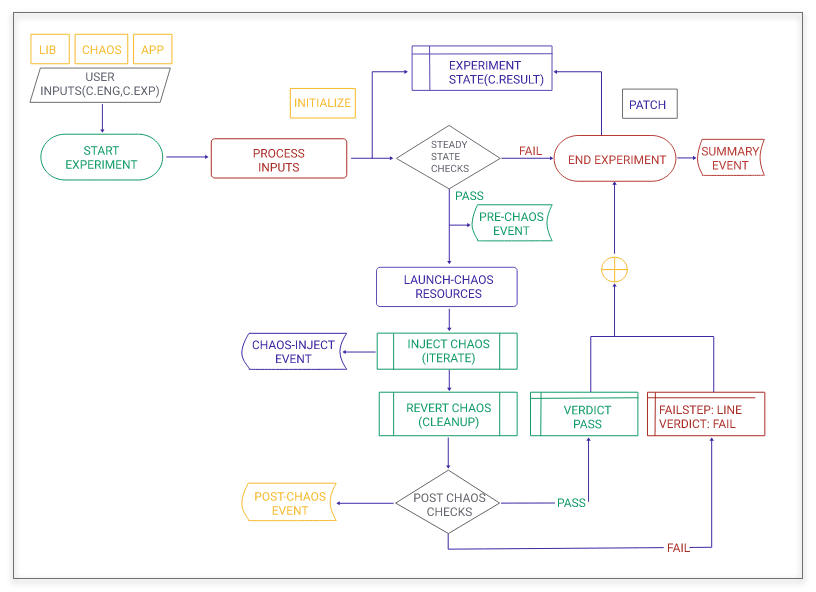
Litmus experiment also consists of steady state checks and post chaos checks which can be changed as per your requirement at the time of chaos implementation.
LitmusChaos experiments
Chaos experiments are the core part of Litmus. We expect that these experiments are going to be continuously tuned and new ones added through ChaosHub.
There is a group of experiments categorized as generic. These will cover chaos for any generic Kubernetes resources or physical components.
The other group is called application-specific chaos experiments. Chaos specific to an application logic is covered in these experiments. We encourage the cloud-native application maintainers and developers to share their fail path tests into the ChaosHub so that their users can run the same experiments in production or staging through Litmus.
Hub has around 32 experiments currently. Some of the important experiments are:
| Experiment Name | Description |
|---|---|
| Node graceful loss/maintenance (drain, eviction via taints) | K8s Nodes forced into NotReady state via graceful eviction |
| Node resource exhaustion (CPU, Memory Hog) | Stresses the CPU & Memory of the K8s Node |
| Node ungraceful loss (kubelet, docker service kill) | K8s Nodes forced into NotReady state via ungraceful eviction due to loss of services |
| Disk Loss (EBS, GPD) | Detaches EBS/GPD PVs or Backing stores |
| DNS Service Disruption | DNS pods killed on the Cluster DNS Service deleted |
| Pod Kill | Random deletion of the pod(s) belonging to an application |
| Container Kill | SIGKILL of an application pod’s container |
| Pod Network Faults (Latency, Loss, Corruption, Duplication) | Network packet faults resulting in lossy access to microservices |
| Pod Resource faults (CPU, Memory hog) | Simulates resource utilization spikes in application pods |
| Disk fill (Ephemeral, Persistent) | Fills up disk space of ephemeral or persistent storage |
| OpenEBS | Chaos on control and data plane components of OpenEBS, a containerized storage solution for K8s |
Creating your own experiments
ChaosHub provides ready to use experiments that can be tuned to your needs. These experiments cover your initial Chaos Engineering needs and help you in getting started with the practice of chaos engineering. Soon, you will have to develop LitmusChaos experiments specific to your application, and Litmus provides an easy-to-use SDK for that. Litmus SDK is available in GO, Python, and Ansible languages. By using this SDK, you can create the skeleton of your new experiment in a few steps and start adding your chaos logic. Adding your chaos logic, pre- and post-experiment checks will make your experiment complete and ready to be used on the Litmus infrastructure.
Monitoring chaos
The litmus portal, which is under development, is adding many charts to help monitor chaos experiments, workflows, and interpret their results. You can currently use the chaos metrics exported to Prometheus to plot the chaos events right onto your existing application monitoring graphs. The below diagram is an example of showing chaos injected into the microservices demo application “sock-shop.” The red areas are chaos injections.
How to get started?
You can create your first chaos in three simple steps.
- Install Litmus through helm
- Choose your application and your chaos experiment from ChaosHub (for example a pod-delete experiment)
- Create a ChaosEngine manifest and run it.
Read this blog that gives you a quick start guide experience for Litmus on a demo application. https://dev.to/uditgaurav/get-started-with-litmuschaos-in-minutes-4ke1
Roadmap
The Litmus project roadmap is summarized at https://github.com/litmuschaos/litmus/blob/master/ROADMAP.md
Monthly community meetings are used to take the feedback from the community and use them to prioritize the next month or quarter roadmap. Chaos workflow management and monitoring are one of the current features under active development. Long term roadmap of Litmus is to add application-specific experiments to the hub to cover the entire spectrum of CNCF landscape.
Contributing to LitmusChaos
Contributing guidelines are here https://github.com/litmuschaos/litmus/blob/master/CONTRIBUTING.md
Litmus portal is under active development, and so are a lot of new chaos experiments. Visit our roadmap section or issues to see if you can find what matches your interest. If not, no problem, join our community at #litmus channel on Kubernetes slack and just say hello.
Community
- Monthly sync up meetings happens on the third Wednesday of every month. Join this meeting to speak to maintainers online and also discuss how you can help with your contributions or seek prioritization of an issue or a feature request.
- The project encourages open communication and governance. We have created Special Interest Groups or SIGs to allow participation in their areas of contributor’s interest. See https://github.com/orgs/litmuschaos/teams?query=SIG
- Community interactions happen at the #litmus channel in Kubernetes slack. Join at https://slack.litmuschaos.io
- Contributor interactions happen at the #litmus-dev channel in Kubernetes slack. Join at https://slack.litmuschaos.io
Conclusion
Kubernetes SREs can achieve the resilience improvements gradually with the adoption of Chaos-First principle and cloud-native chaos engineering principles. Litmus is a toolset of framework to get you started and complete this mission all the way.
Guest post by Uma Mukkara, Maintainer on LitmusChaos Project and COO at MayaData
For enquiries, product placements, sponsorships, and collaborations, connect with us at [email protected]. We'd love to hear from you!
Our humans need coffee too! Your support is highly appreciated, thank you!


