When you are dealing with a situation that fires a bevy of alerts, do you instinctively know which alerts are the most pressing? Severity levels are an important concept in alerting to aid you and your team in properly assessing which notifications should be prioritized. You can use these levels to focus on the issues deemed most critical for your operations and triage through the noise. Today, we’re happy to announce that you can create custom severity levels on your alert policies and have this data included in your notifications for more effective alerting and integration with downstream third-party services (e.g. Webhook, Cloud Pub/Sub, PagerDuty).
The notification channels have been enhanced to accept this data – including Email, Webhooks, Cloud Pub/Sub, and PagerDuty – with planned support for Slack at a later time. This enables further automation/customization based on importance wherever the notifications are consumed.
From our partners:
Below, we’ll walk through examples of how to add static and dynamic severity levels to an Alert Policy.
Create user labels to support static severity levels
When you add user labels on an alert policy, they will appear on every notification and incident generated by that alert policy. Refer to the documentation to see how to add user labels to alert policies via the Alert Policy API.
Let’s walk through an example: suppose you want to configure Alert Policies that notify you when the CPU utilization crosses a particular threshold. Further, you want the notifications to indicate the following severity levels:
infowhen CPU utilization is between 70% and 80%warningwhen CPU utilization is between 80% and 90%criticalwhen CPU utilization is above 90%
To accomplish this, you can create three separate alert policies with user labels defined as below:
Create alert policy (A) which triggers when the CPU utilization is above 90%, and includes the following user labels: any incident generated by this policy will include a label severity with value critical.
"userLabels": {
“severity”: “critical”,
}
Create a second policy (B) which triggers when resource CPU utilization is above 80%, and includes the following user labels: any incident generated on this policy will include a label severity with value warning.
"userLabels": {
“severity”: “warning”,
}
Create a third policy (C) which triggers when resource CPU utilization is above 70%, and includes the following user labels: any incident generated on this policy will include a label severity with value info.
"userLabels": {
“severity”: “info”,
}
In this scenario, when the CPU utilization crosses a threshold of 90% policies A, B, and C will trigger alerts. If the CPU utilization falls back down to 85%, the incident from policy A will close, but the incidents from policies B and C will remain open. If the CPU utilization falls even further down to 75%, the incident from policy B will close, and the incident from policy C will remain open. If the CPU utilization drops down to 40%, incidents generated by all three policies will automatically close.
Use MQL to create dynamic severity levels
Alert policy user labels are static in nature, meaning you cannot dynamically apply user labels based on a changing threshold. As shown earlier, you need to create three separate alert policies to generate notifications that contain user label severity with value:
infobelow a threshold of 80%,warningbelow a threshold of 90%, andcriticalabove a threshold of 90%.
If you’d like to dynamically apply the severity level based on threshold within a single alert policy, you can use MQL. You can utilize MQL to create alert policies with dynamic custom metric labels that will be embedded in the incident. Via MQL map, you can specify what threshold level should result in which severity label. This means you can accomplish the above scenario of three severity levels based on threshold by creating only one alert policy.
Take the sample MQL query below:
fetch gce_instance| metric 'compute.googleapis.com/instance/cpu/utilization'| filter (metadata.user_labels.env == 'prod') && (resource.zone =~ 'asia.*')| group_by sliding(5m), [value_utilization_mean: mean(value.utilization)]| mapadd[severity:if(val() > 90 '%', 'critical',if(val() >= 80 '%' && val() <= 90 '%', 'warning', 'info'))]| condition val() > 70 '%'
In this example, an incident will be created any time CPU utilization is above a threshold of 70%. If the value is between 70-80%, the incident will contain a metric label called severity with value info. If the value is between 80-90%, the metric label severity will have value WARNING, and if the value is above 90%, the label severity will have value critical.
In the above scenario, if the CPU utilization value starts at 92%, incident A will be created with severity level critical. If the utilization value then drops down to 73%, a new incident B will be opened with severity level info. Incident A, however, will remain open. If the value jumps to 82%, a new incident C will open with severity level warning and incidents A and B will remain open. If auto-close is configured in your policy with a duration of 30 minutes, incident `A` will auto-close 30 minutes after incident `B` starts, and incident `B` will auto-close 30 minutes after incident `C` starts. If the value drops below 70%, all incidents will close.
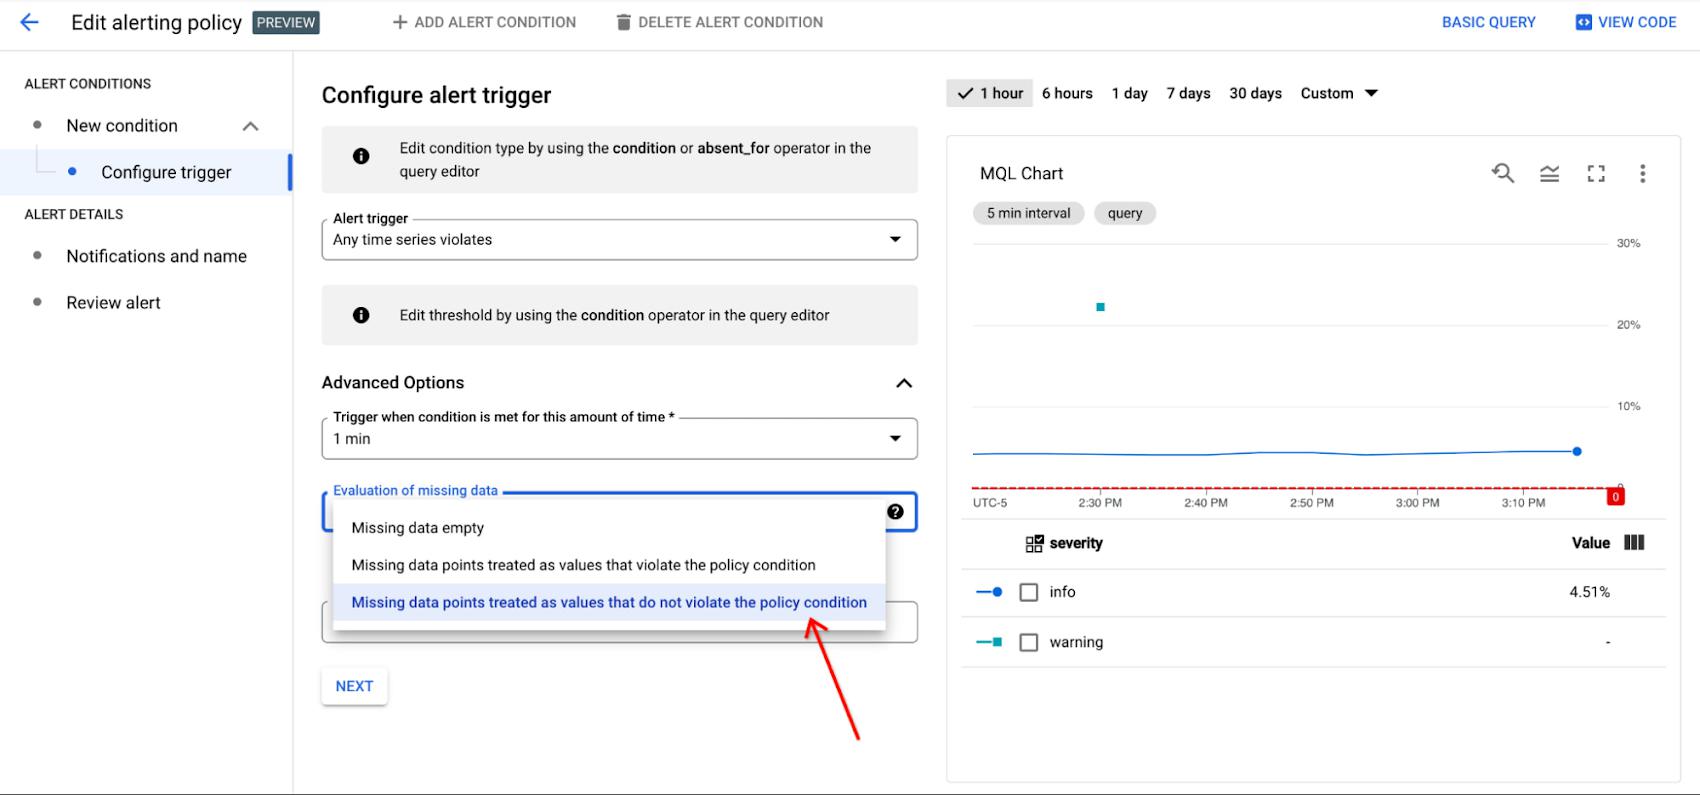
In order to ensure the alert policy only has one incident open at a time with the correct corresponding label, and to avoid waiting for incidents to auto-close as in the example above, set evaluationMissingData to EVALUATION_MISSING_DATA_INACTIVE in your API request. This field tells the Alert Policy how to handle situations when the metric stream has sparse or missing data, so the incident can be closed appropriately as needed. If you are making your MQL alert policy in the UI, select the Missing data points treated as values that do not violate the policy condition button in the Advanced Options dropdown in the Configure Trigger section:

When EVALUATION_MISSING_DATA_INACTIVE is specified in the above scenario, incident A will close once incidentB is created, and incident B will close once incident C is created.
Severity Labels in Notification Channels
If you send notifications to a third-party service like PagerDuty, Webhooks, or Pub/Sub then you can parse the JSON payload and route the notification according to its severity so that critical information is not missed by your team.
If you utilize alert policy user labels, these will appear as an object on the notification with the key policy_user_labels i.e.:
"policy_user_labels": {"severity": "critical",}
If you utilize metric labels via MQL, these will appear as an object with key labels nested in an object with key metric i.e.:
"metric": {"displayName": "Some Display Name","labels": {"instance_name": "some_instance_name","severity": "critical"},}
Get Started Today
Alerts can be configured on nearly any metric, log, or trace (or the absence of that data) that is captured in Google Cloud’s operations suite. Severity levels give you and your teams an additional way to cut through noise to find the issues that you know will have the most positive impact when resolved. Check out this video on log alerts as part of our Observability in-depth video series and if you have questions, feature requests, or just want to read topics from other customers who are using Cloud Alerting, visit our Google Cloud Community site.
By: Alizah Lalani (Software Engineer)
Source: Google Cloud Blog
For enquiries, product placements, sponsorships, and collaborations, connect with us at [email protected]. We'd love to hear from you!
Our humans need coffee too! Your support is highly appreciated, thank you!