Setting up Service Level Objectives (SLOs) is one of the foundational tasks of Site Reliability Engineering (SRE) practices, giving the SRE team a target against which to evaluate whether or not a service is running reliably enough. The inverse of your SLO is your error budget — how much unreliability you are willing to tolerate. Once you’ve identified those targets and learned how to set SLOs, the next question you should ask yourself is whether your SLOs are realistic, given your application architecture and team practices? Are you sure that you can meet them? And what’s most likely to spend the error budget?
At Google, SREs answer these questions up front when they take on a new service, as part of a Production Readiness Review (PRR). The intention of this risk analysis is not to prompt you to change your SLOs, but rather to prioritize and communicate the risks to a given service, so you can evaluate whether you’ll be able to actually meet your SLOs, with or without any changes to the service. In addition, it can help you identify which risks are the most important to prioritize and mitigate, using the best available data.
From our partners:
You can make your service more reliable by identifying and mitigating risks.
Risk analysis basics
Before you can evaluate and prioritize your risks, though, you need to come up with a comprehensive list of things to watch out for. In this post, we’ll provide some guidelines for teams tasked with brainstorming all the potential risks to an application. Then, with that list in hand, we’ll show you how to actually analyze and prioritize the risks you’ve identified.
What risks do you want to consider?
When brainstorming risks, it’s important to try to map risks in different categories — risks that are related to your dependencies, monitoring, capacity, operations, and release process. And for each of those, imagine what will happen if specific failures happen, for example, if a third party is down, or if you introduce an application or configuration bug. Thus, when thinking about your measurements, ask yourself:
- Are there any observability gaps?
- Do you have alerts for this specific SLI?
- Do you even currently collect those metrics?
Also be sure to also map any monitoring and alerting dependencies. For example, what happens if a managed system that you use goes down?
Ideally, you want to identify the risks associated with each failure point for each critical component in a critical user journey, or CUJ. And after identifying those risks, you will want to quantify them:
- What percentage of users was affected by the failure?
- How often do you estimate that failure will occur?
- How long did it take to detect the failure?
It’s also helpful to gather information about any incidents that happened in the last year that affected CUJs. Compared with gut feelings, relying on historical data can provide more accurate estimates and a good starting point for actual incidents. For example, you may want to consider incidents such as:
- A configuration mishap that reduces capacity, causing overload and dropped requests
- A new release that breaks a small set of requests; the failure is not detected for a day; quick rollback when detected.
- A cloud provider’s single-zone VM/network outage
- A cloud provider’s regional VM/network outage
- The operator accidentally deletes a database, requiring a restore from backup
Another aspect to think about is risk factors; these are global factors that affect the overall time to detection (TTD) and time to repair (TTR). These tend to be operational factors that can increase the time needed to detect outages (for example when using log-based metrics) or alert the on-call engineers. Another example could be a lack of playbooks/documentation or lack of automatic procedures. For example, you have:
- Estimated time to detection (ETTD) of +30m due to operational overload such as noisy alerting
- A 10% greater frequency of a possible failure, due to lack of postmortems or action item follow-up
Brainstorming guidelines: Recommendation for the facilitator
Beyond the technical aspects of what to look for in a potential risk to your service, there are some best practices to consider when holding a brainstorming session with your team.
- Start the discussion with a high-level block diagram of the service, its users, and its dependencies.
- Get a set of diverse opinions in the room — different roles that intersect with the product differently than you do. Also, avoid having only one party speak. Ask participants for the ways in which each element of the diagram could cause an error to be served to the user. Group similar root causes together into a single risk category, such as “database outage”.
- Try to avoid spending too long discussing things where the estimated time between a given failure is longer than a couple of years, or where the impact is limited to a very small subset of users.
Creating your risk catalog
You don’t need to capture an endless list of risks; seven to 12 risks per Service Level Indicator (SLI) are sufficient. The important thing is that the data capture high probability and critical risks.
- Starting with real outages is best. Those can be as simple as unavailability of <depended service or network>.
- Capture both infrastructure- and software-related issues.
- Think about risks that can affect the SLI, the time-to-detect and time-to-resolve, and frequency — more on those metrics below.
- Capture both risks in the risk catalog and risk factors (global factors). For example, the risk of not having a playbook adds to your time-to-repair; not having alerts for the CUJ adds to the time-to-detection; the risk of a log sync delay of x minutes increases your time-to-detection by the same amount. Then, catalog all these risks and their associated impacts to a global impacts tab.
Here are a few examples of risks:
- A new release breaks a small set of requests; not detected for a day; quick rollback when detected.
- A new release breaks a sizable subset of requests; and no automatic rollback.
- A configuration mishap reduces capacity / Unnoticed growth in usage hits max.
Recommendation: Examining the data/result of implementing the SLI will give you a good indication of where you stand in regard to achieving your targets. I recommend starting with creating one dashboard for each CUJ — ideally a dashboard that includes metrics that will also allow us to troubleshoot and debug problems in achieving the SLOs.
Analyzing the risks
Now that you’ve generated a list of potential risks, it’s time to analyze them, in order to prioritize their likelihood, and potentially find ways to mitigate against them. It’s time, in other words, to do a risk analysis.
Risk analysis provides a data-driven approach to address and prioritize the needed risks, by estimating four key dimensions: the above-mentioned TTD and TTR, as well as time-between failures (TBF), and their impact on users.
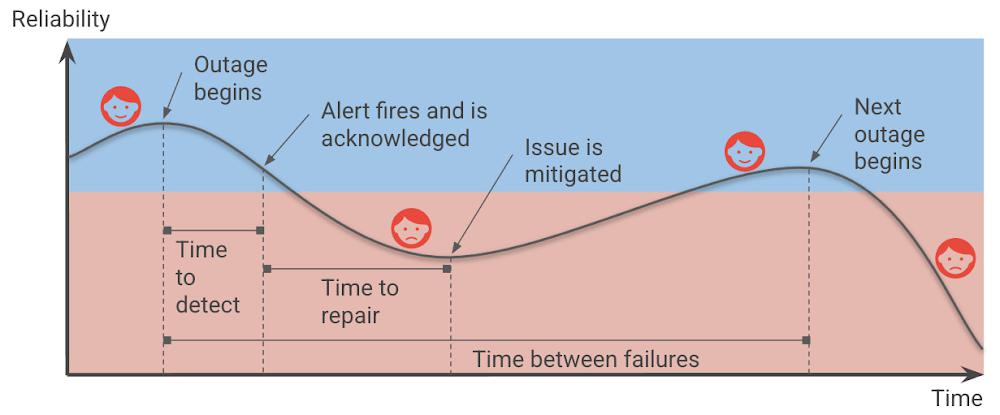
In Shrinking the impact of production incidents using SRE principles, we introduced a diagram of the production incident cycle. Blue represents when users are happy, and red represents when users are unhappy.
The time that your services are unreliable and your users are unhappy consists of the time-to-detect and the time-to-repair, and is affected by the frequency of incidents (which can be translated to time-between-failures).
Therefore, we can improve reliability by increasing the time between failures, decreasing the time-to-detect or time-to-repair, and of course, reducing the impact of the outages in the first place.
Engineering your service for resiliency can reduce the frequency of total failures. You should avoid single points of failure in your architecture, whether it be an individual instance, availability zone, or even an entire region, which can prevent a smaller, localized outage from snowballing into global downtime.
You can reduce the impact on your users by reducing the percentage of infrastructure or users affected or the requests (e.g., throttling part of the requests vs. all of them). In order to reduce the blast radius of outages, avoid global changes and adopt advanced deployments strategies that allow you to gradually deploy changes. Consider progressive and canary rollouts over the course of hours, days, or weeks, which allow you to reduce the risk and to identify an issue before all your users are affected.
Further, having robust Continuous Integration and Continuous Delivery (CI/CD) pipelines allows you to deploy and roll back with confidence and reduce customer impact (See: SRE Book: Chapter 8 – Release Engineering). Creating an integrated process of code review and testing will help you find the issues early on before users are affected.
Improving the time to detect means that you catch outages faster. As a reminder, having an estimated TTD expresses how long until a human being is informed of the problem. For example, imagine someone receives and acts upon a page. TTD also includes any delays until the ‘detection’ like data processing. For example, if I’m using a log-based alert, and my log system has an ingestion time of 5 minutes, this increases the TTD for every alert by 5 minutes.
ETTR (estimated time-to-repair) is the time between the time a human sees the alert and the time your users are happy. Improving time-to-repair means that we fix outages quicker, in principle. That said, our focus should still be “does this incident still affect our users?” In most cases mitigations like rolling back new releases or diverting traffic to unaffected regions can reduce or eliminate the impact of an ongoing outage on users much faster than trying to roll forward to a new, patched build. The root cause isn’t yet fixed, but the users don’t know or care — all they see is that the service is working again.
While it takes the human out of the loop, using automation can reduce the TTR and can be crucial to achieving higher reliability targets. However, it doesn’t eliminate the TTR altogether, because even if a mitigation such as failing over to a different region is automated, it still takes time for it to have an impact.
A note about “estimated” values: At the beginning of a risk analysis, you might start with rough estimates for these metrics. But as you collect more data from incidents data you can update these estimates based on data from prior outages.
Risk analysis process at a high level
The risk analysis process starts by brainstorming risks for each of your SLOs, and more correctly for each one of your SLIs, as different SLIs will be exposed to different risks. In the next phase, build a risk catalog and iterate on it.
- Create a risk analysis sheet for two or three SLIs, using this template. Read more at How to prioritize and communicate risks.
- Brainstorm risks internally, considering the things that can affect your SLOs, and gathering some initial data. Do this first with the engineering team and then include the product team.
- The risk analysis sheets for each of your SLIs should include ETTD, ETTR, impact, and frequency. Include global factors and suggested risks and whether these risks are acceptable or not.
- Collect historical data and consult with the product team regarding the SLO-business needs.
- Iterate and update data based on incidents in production.
Accepting risks
After building the risk catalog and capturing the risk factors, finalize the SLOs according to business need and risk analysis. This step means you need to evaluate whether your SLO is achievable given the risks, and if it isn’t — what do you need to do to achieve your targets? It is crucial that PMs be part of this review process especially as they might need to prioritize engineering work that mitigates or eliminates any unacceptable risks.
In how to prioritize and communicate risks, we introduce how to use the ‘Risk Stack Rank’ sheet to see how much a given risk may “cost” you, and which risks you can accept (or not) for a given SLO. For example, in the template sheet, you could accept all risks and achieve 99.5% reliability, some of the risks to achieve 99.9% and none of them to achieve 99.99%. If you can’t accept a risk because you estimate that it will burn more error budget than your SLO affords you, that is a clear argument for dedicating engineering time to either fixing the root cause or building some sort of mitigation.
One final note: similar to SLOs, you will want to iterate on your risk refining your ETTD based on actual TTD observed during outages, and similarly for ETTR. After incidents, you need to update the data and see where you stand regarding those estimates. In addition, revisit those estimates periodically to evaluate whether your risks are still relevant, if your estimates are correct, or if there are any additional risks that you need to account for. Like the SRE principle of continuous improvement, it’s work that’s never truly done, but that is well worth the effort!
For more on this topic, check out my upcoming DevOpsDays 2022 talk, taking place in Birmingham on May 6 and in Prague on May 24.
Further reading and resources
- Site Reliability Engineering: Measuring and Managing Reliability (Coursera course)
- Google Cloud Architecture Framework: Reliability
- The Calculus of Service Availability
- Know thy enemy: how to prioritize and communicate risks—CRE life lessons
- Incident Metrics in SRE – Google – Site Reliability Engineering
- SRE on Google Cloud
By: Ayelet Sachto (Strategic Cloud Engineer, Infra, AppMod, SRE)
Source: Google Cloud Blog
For enquiries, product placements, sponsorships, and collaborations, connect with us at [email protected]. We'd love to hear from you!
Our humans need coffee too! Your support is highly appreciated, thank you!


