TL;DR:
- Cloud providers can place multiple VMs of the same cloud customer on a shared physical host – a situation that is difficult to detect with conventional means, but readily apparent with Clockwork’s high precision measurements
- VM colocation has performance implications that are much more severe than simple shared tenancy
- When three or more VMs share the same physical host, the available network bandwidth per VM is impaired
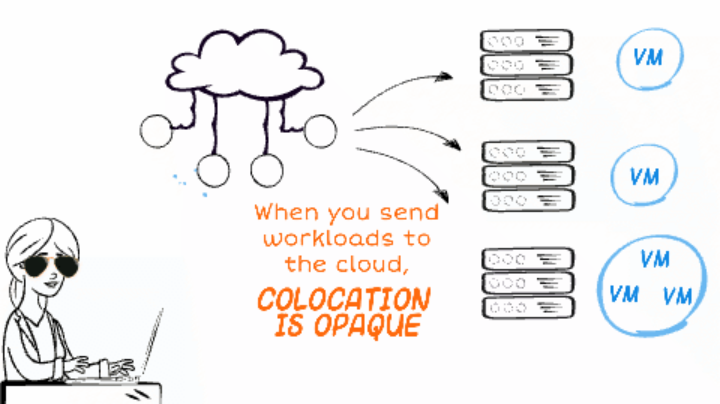
When workloads move to the cloud, the cloud operators use proprietary placement algorithms to map the requested virtual resources onto specific physical hardware in their data centers. While the cloud customer has some coarse control over placement (for example by configuring placement groups), the final placement is controlled by the provider and chosen to maximize their operational objectives.
From our partners:
This means that some virtual machines will end up running on the same physical host, making them next-door neighbors in the cloud. This VM colocation is invisible to cloud customers, creating the impression that all VMs are equal. With Clockwork’s high-accuracy clock sync technology, it becomes possible to infer VM colocation, thus revealing which VMs are running on the same physical host.
How does VM colocation affect the performance of the cloud system? While cloud providers isolate CPU and memory resources very well between VMs, the networking resources are more likely to be oversubscribed. Clockwork offers Latency Sensei, a service that measures your cloud system’s performance, including the impact of VM colocation.
In this two-part blog post series, we’ll take a deep look at the impact of VM colocation on key network performance metrics. We start with network bandwidth in this post, then in our next one, we will see how VM colocation affects other network performance metrics.
The results are the aggregate of thousands of Latency Sensei audits on 50-node Kubernetes clusters in Amazon Web Services (EKS), Google Cloud Platform (GCE), and Microsoft Azure (AKS).
Network Bandwidth
It is well-known that the cloud is fundamentally a shared tenancy environment, and some fair resource sharing is expected. But there is a key difference between next-door neighbors that belong to other cloud customers (shared tenancy) versus the same cloud customer (VM colocation).
When next-door neighbors belong to different cloud customers, the cloud typically works well. This is because the VMs owned by different customers often don’t need the exact same resource at the same time. Each VM’s load peaks at different points in time, and noisy neighbors average out.
In contrast, when your next-door neighbors are your own VMs, they are serving the same workload and competing for the same resources at the same time. Their peak load is very likely to occur at the same point in time. Is the cloud able to provide maximal performance simultaneously?
During a Clockwork Latency Sensei audit, the bandwidth of each VM’s network connection is measured by exchanging long flows of synthetic data among the VMs at maximum speed, thus saturating the virtual network links. This traffic pattern is similar to realistic workloads, for example during the broadcast phase of large-scale machine learning model training.
At each VM, cloud providers apply a rate limiter in the virtual network interface cards (vNICs) to implement the promised virtual link speed for each VM while attempting fair sharing of the physical network resources between VMs. But if a cluster on the cloud includes highly colocated VMs, the throughput is instead limited by the capabilities of the physical NIC that underlies the virtualization.
For example, consider this case of a 50-node cluster on Google Cloud Platform in the us-east4-c region with n1-standard-4 VMs (see full audit report).
The bubble diagram shows which VMs are hosted on the same physical machine.
The bar chart shows the egress bandwidth of each of the VMs.
For most non-colocated VMs, the nominal bandwidth of 10Gbps is actually achieved (purple bars). For colocated VMs, the bandwidth is limited severely below the promised amount (red bars). The group of 7 VMs that share a physical host achieve only 2.5Gbps per host.
We have run bandwidth measurements for thousands of Kubernetes clusters in Google Cloud Platform (GKE), Amazon Web Services (EKS), and Microsoft Azure (AKS). Let’s see how severe this effect is on average over many examples of cloud clusters.
Google Cloud Platform (GKE)
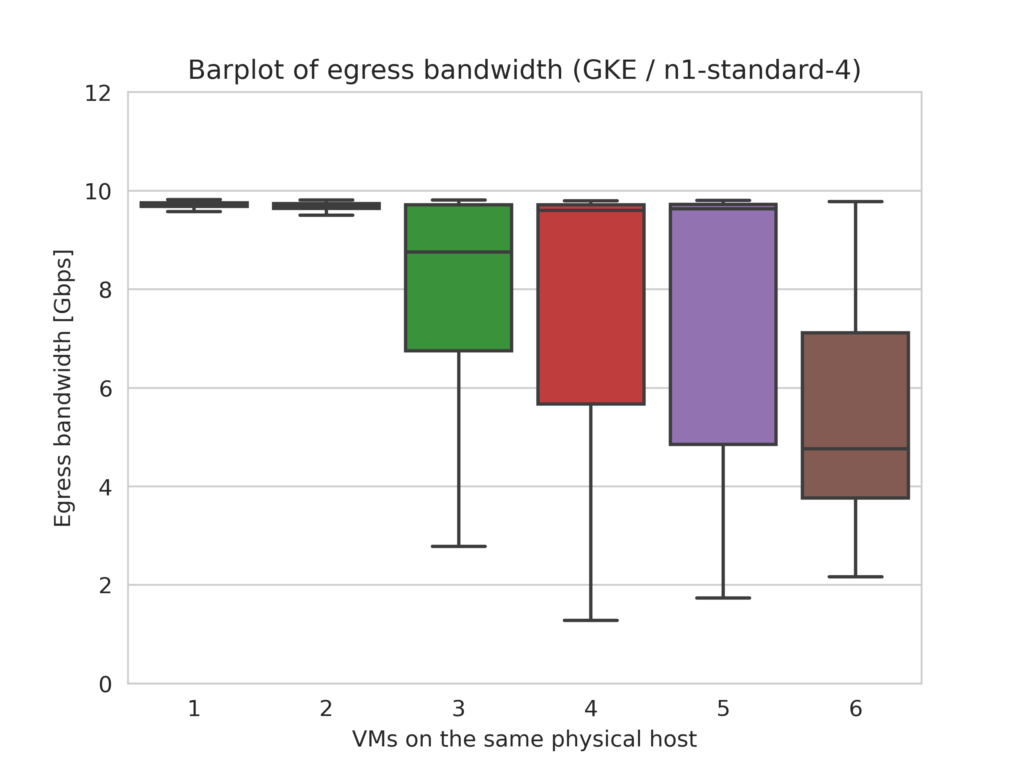
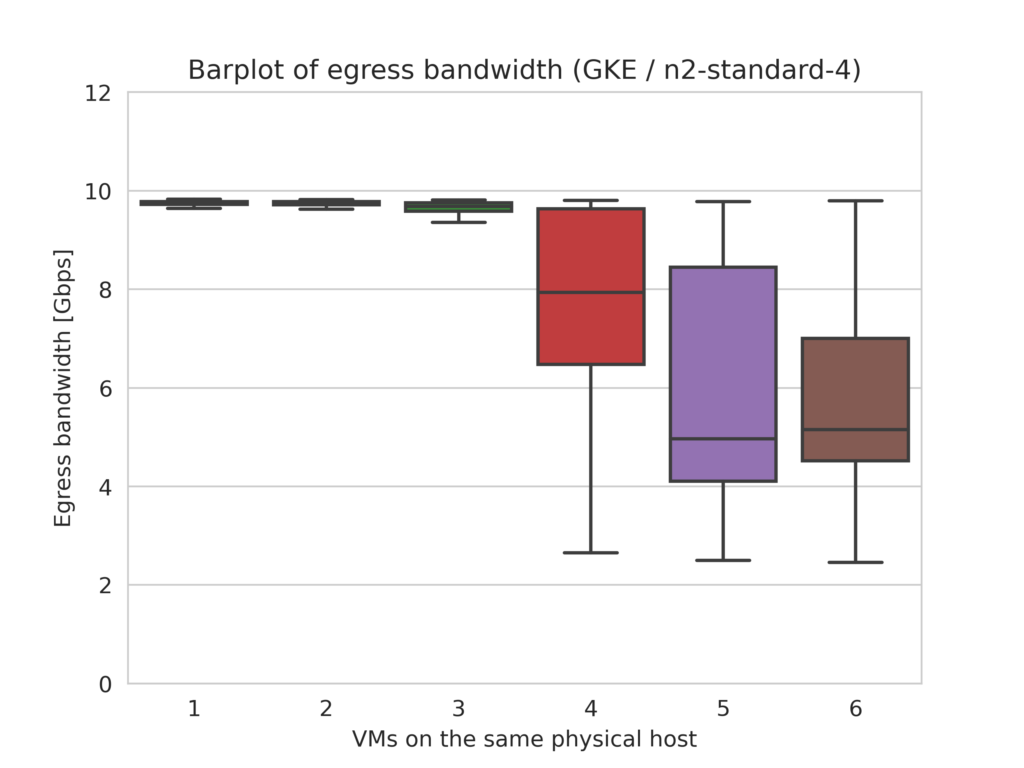
For VM types with nominal bandwidth of 10 Gbps on Google Cloud, bandwidth limitations start to appear with as little as 3 colocated VMs, and get progressively more severe as 4, 5 or even 6 VMs are hosted on the same machine.
Amazon Web Services (EKS)
By policy, compute instances in AWS EC2 are purposefully placed on separate hardware whenever possible to minimize the probability of simultaneous failures [Link]. This means colocation is rarer than in the other clouds. In fact, for m5 family compute instances, only 0.3% of 600+ test clusters we ran with 50 VMs each included a physical machine hosting four or more VMs. Typically, no more than three VMs share a physical host, and these VMs do not incur bandwidth loss. They all achieve their nominal bandwidth of 10Gbps.
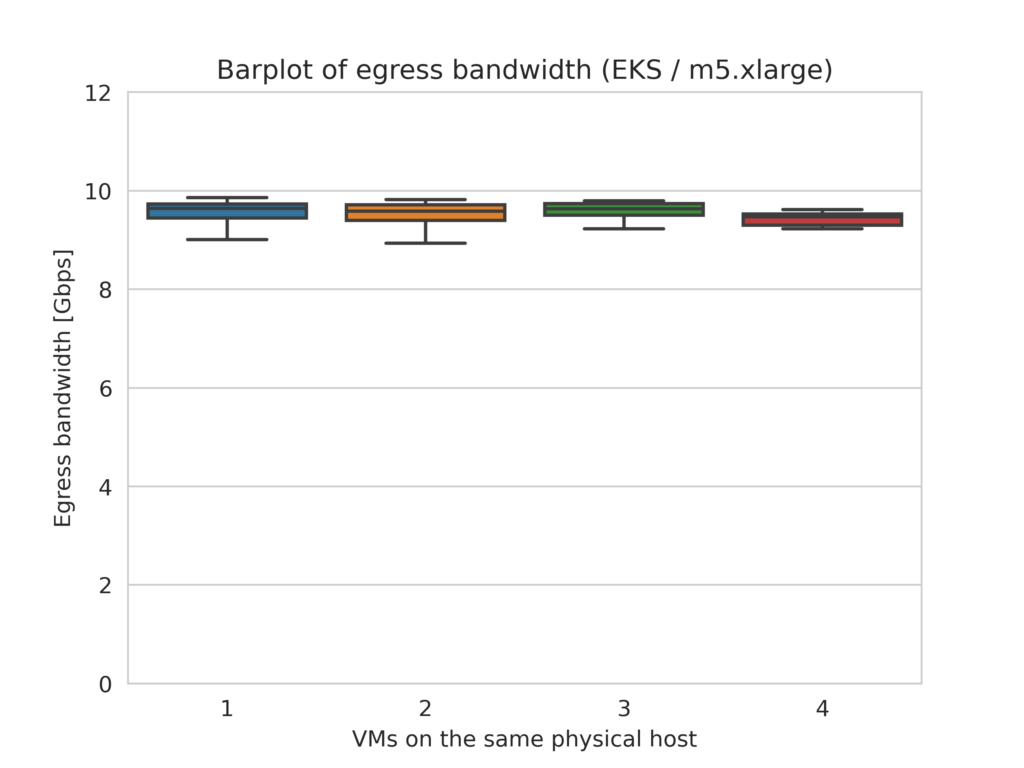
The m4.xlarge EC2 instance type severely limits bandwidth to about 770 Mbps. AWS places these instances slightly more aggressively than m5, but the relatively low bandwidth baseline is not further impaired due to colocation.
Microsoft Azure (AKS)
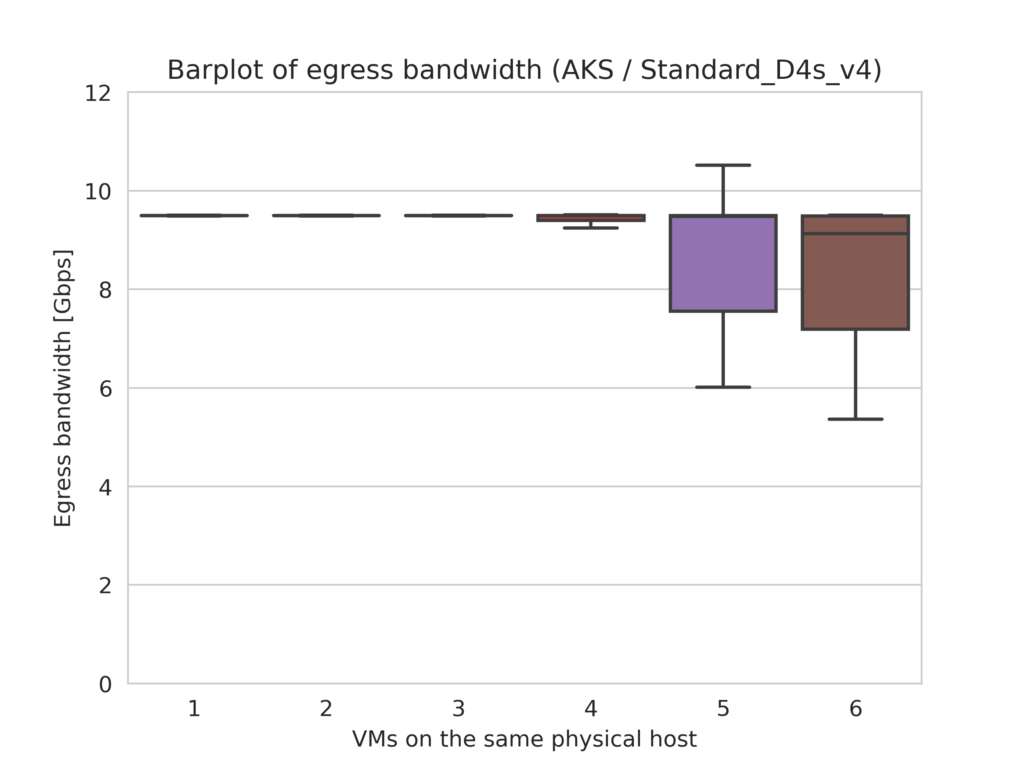
In Azure clusters, the per-VM bandwidth is limited below the nominal value when five or more VMs are hosted by the same physical machine. On the plus side, Azure allocates larger bandwidth much beyond the nominal value to VMs that run during times of low overall cloud load.
See for yourself
Colocation affects the network performance of cloud-based VMs. When VMs are too densely packed with three or more VMs on the same physical host, the available network bandwidth is significantly lower than the nominal value that you are paying for.
Clockwork Latency Sensei provides visibility into VM colocation and its impact on network bandwidth. Browse the Latency Sensei Audit report gallery to see example reports, and download Latency Sensei to run audit reports on your own cloud deployment.
How does VM colocation affect other network performance metrics? Read our follow-up blogpost to find out more.
Interested in solving challenging engineering problems and building the platform that powers the next generation time-sensitive application? Join our world-class engineering team.
Guest post originally published on the Clockwork blog
Source CNCF
For enquiries, product placements, sponsorships, and collaborations, connect with us at [email protected]. We'd love to hear from you!
Our humans need coffee too! Your support is highly appreciated, thank you!
