Financial services institutions are increasingly aware of the significant role they can play in addressing climate change. As allocators of capital through their lending and investment portfolios, they direct financial resources for corporate development and operations in the wider economy.
This capital allocation responsibility balances growth opportunities with risk assessments to optimize risk-adjusted returns. Identifying, analyzing, reporting, and monitoring climate risks associated with physical hazards, such as wildfires and water scarcity, is becoming an essential element of portfolio risk management.
From our partners:
Implementing a cloud-native portfolio climate risk analytics system
To help quantify these climate risks, this design pattern includes cloud-native building blocks that financial services institutions can use to implement a portfolio climate risk analytics system in their own environment. This pattern includes a sample dataset from RS Metrics and leverages several Google Cloud products, such as BigQuery, Data Studio, Vertex AI Workbench, and Cloud Run. The technical architecture is shown below.
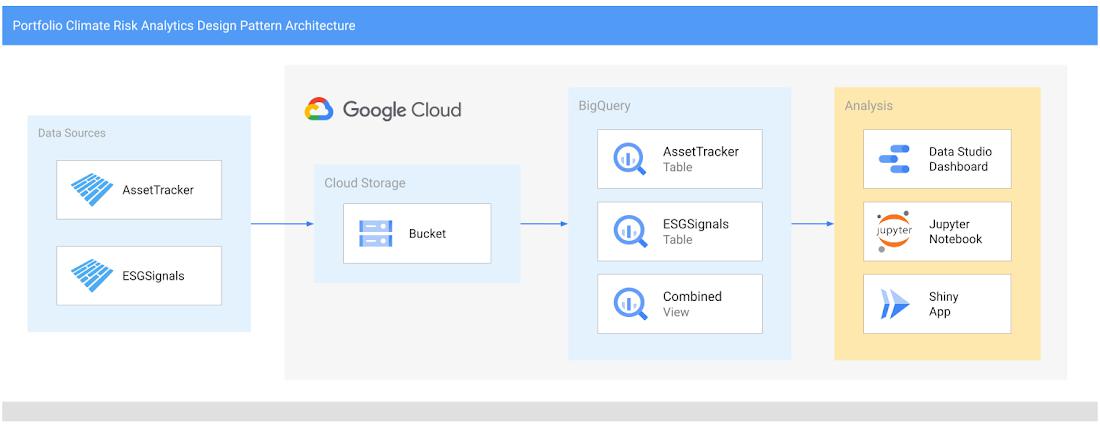

Please refer to the source code repository for this pattern to get started, and read through the rest of this post to dig deeper into the underlying geospatial technology and business use cases in portfolio management. You can use the Terraform code provided in the repository to deploy the sample datasets and application components in your selected Google Cloud Project. The README has step-by-step instructions.
After deploying the technical assets, we recommend performing the following steps to get more familiar with the pattern’s technical capabilities:
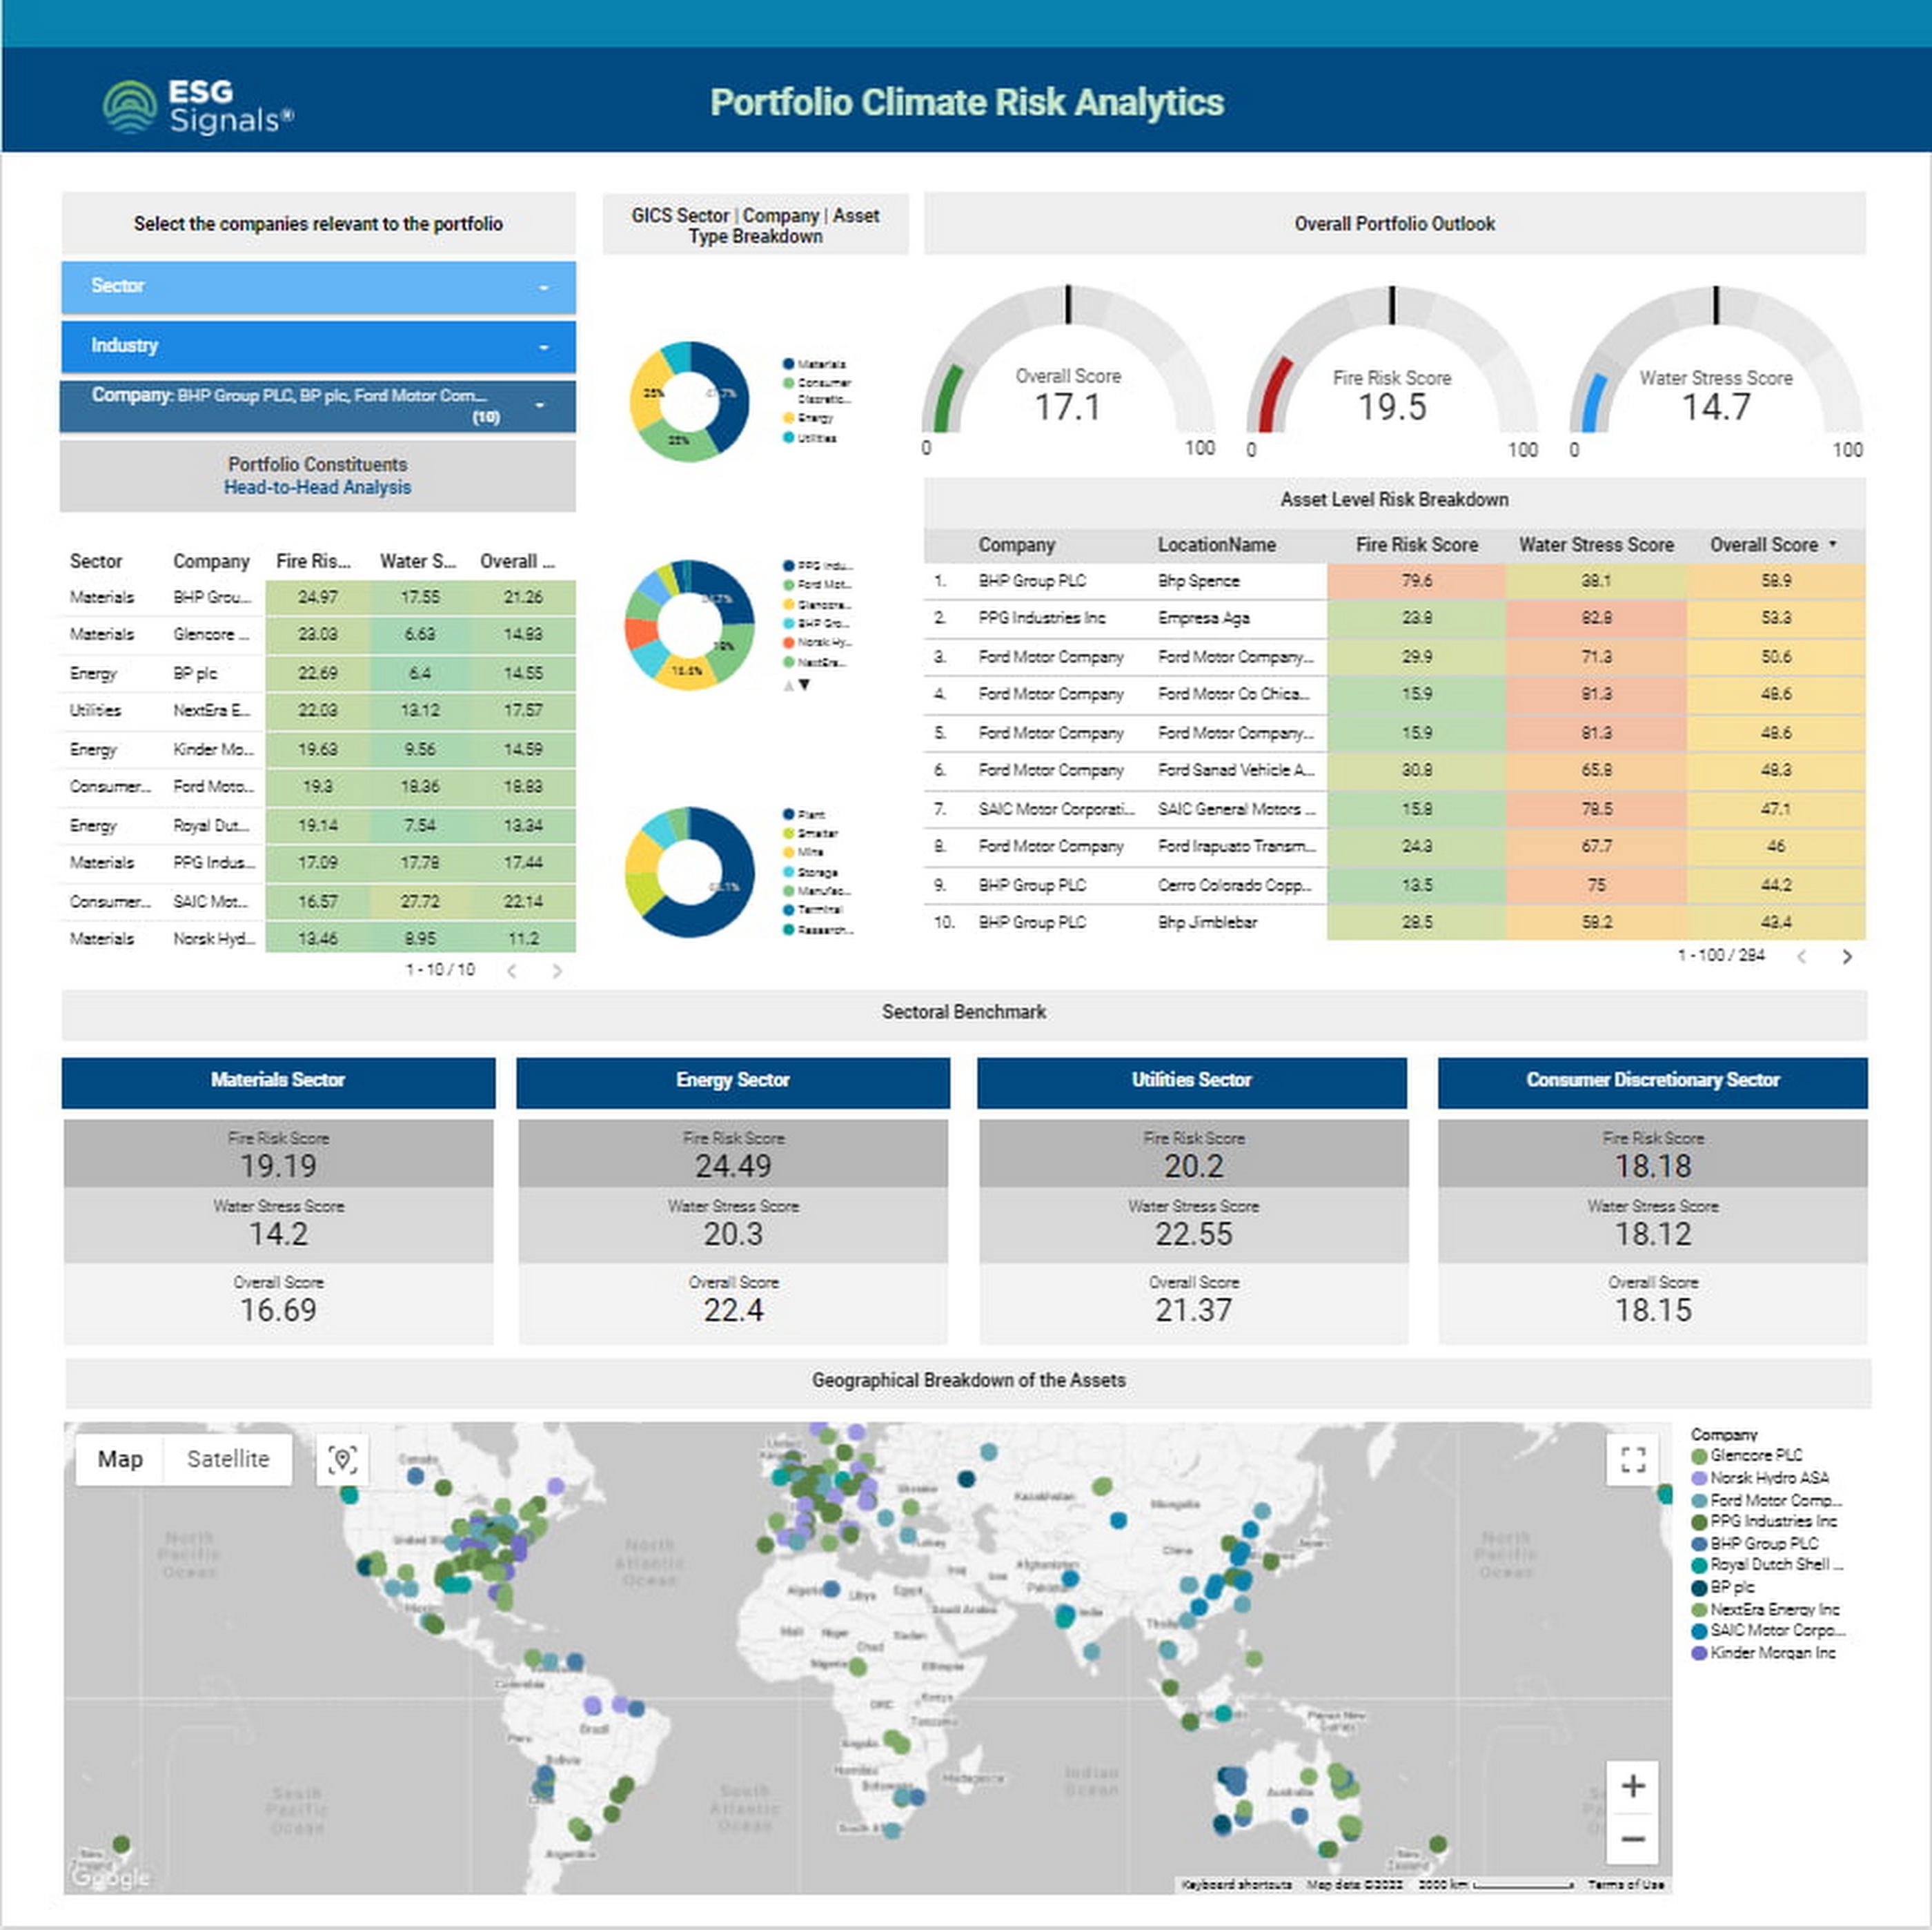
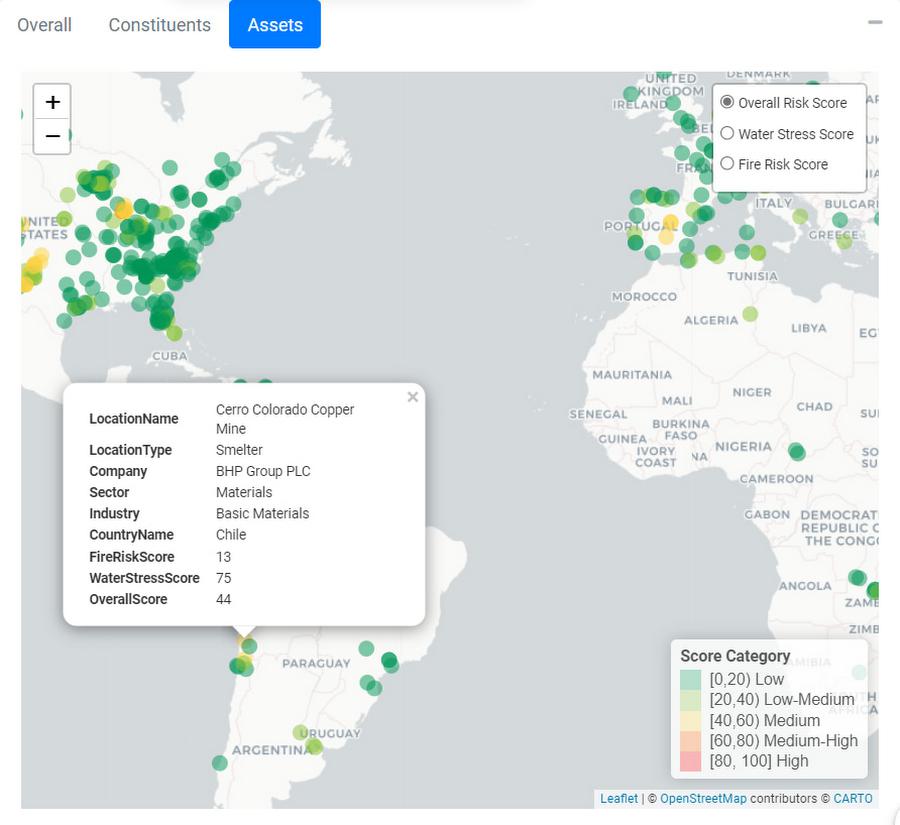
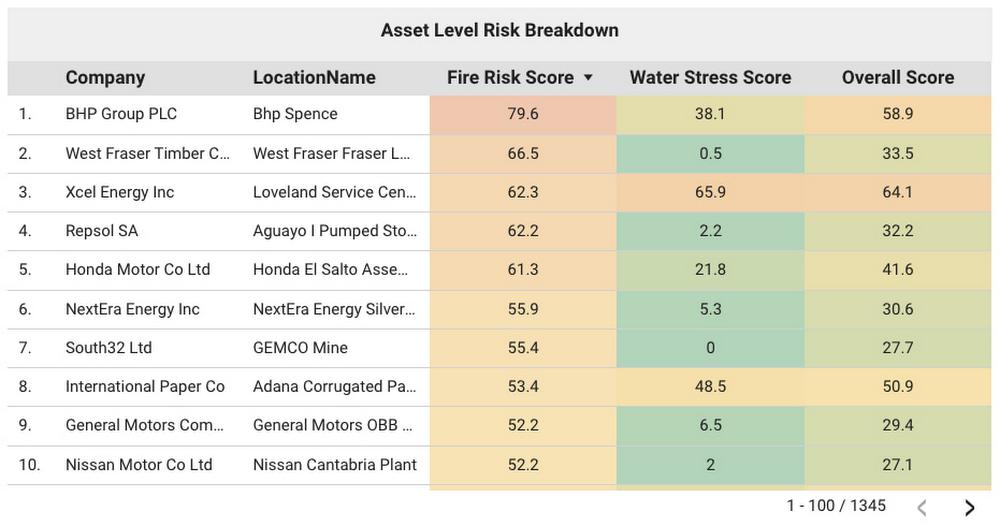
- Review the example Data Studio dashboard to get familiar with the dataset and portfolio risk analytics (see screenshot below)
- Explore the included R Shiny app, deployed with Cloud Run, for more in-depth analytics
- Visit Vertex AI Workbench and walk through the exploratory data analysis provided in the included Python-based Jupyter notebook
- Drop into BigQuery to directly query the sample data for this pattern

The importance of granular objective data
Assessing exposure to climate risks under various climate change scenarios can involve combining geospatial layers, expertise in climate models, and using information about company operations. Depending on where they are located, companies’ physical assets – like their manufacturing facilities or office buildings – can be susceptible to varying types of climate risk. A facility located in a desert will likely experience greater water stress, and a plant located near sea level will have a larger risk of coastal flooding.
Asset-level physical climate risk analysis
Google Cloud partner RS Metrics offers two data products that cover a broad set of investable public equities: ESGSignals® and AssetTracker®. These products include 50 transition and physical climate risk metrics such as biodiversity, greenhouse gas (GHG) emissions, water stress, land usage, and physical climate risks. As an introduction to these concepts, we’ll first describe two key physical risks: water stress risk and fire risk.
Water Stress Risk
Water stress occurs when an asset’s demand for water exceeds the amount of water available for that asset, resulting in higher water costs or in extreme cases, complete loss of water supply. This can negatively impact the unit economics of the asset, or even result in the asset being shut down. According to a 2020 report from CDP, 357 surveyed companies disclosed a combined $301 billion in potential financial impact of water risks.
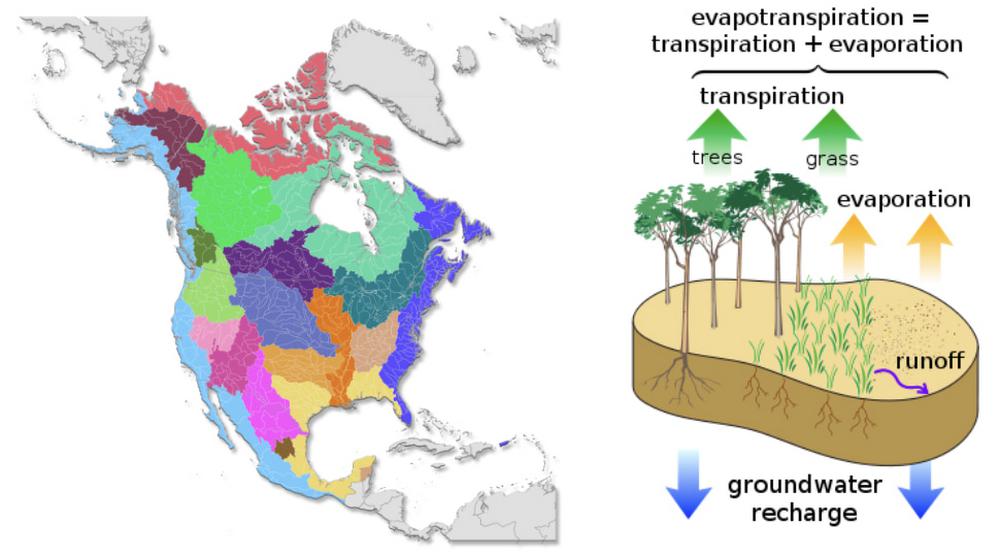
When investors don’t have asset location data, they use industry average water intensity and basin level water risk to estimate water stress risk, as described in a 2020 report by Ceres. However, ESGSignals® allows a more granular approach, integrating meteorological and hydrological variables at the basin and sub-basin levels, drought severity, evapotranspiration, and surface water availability for millions of individual assets.

As an example, let’s look at mining, a very water-intensive industry. One mining asset, the Cerro Colorado copper mine in Chile, produced 71,700 metric tons of copper in 2019, according to an open dataset published by Chile’s Ministry of Mining. ESGSignals® identifies this mining asset as having significant water stress, resulting in a water risk score of 75 out of 100. For assets like these, reducing water consumption via efficiency improvements and the use of desalinated seawater will not only save precious water resources for nearby communities, but also reduce operating costs over time.

Fire Risk
Wildfires have caused significant damage in recent years. For example, economists estimated that the 2019-2020 Australian bushfire season caused approximately A$103 billion in property damage and economic losses. Such wildfires pose safety and operational risk for all kinds of commercial operations located in Australia.
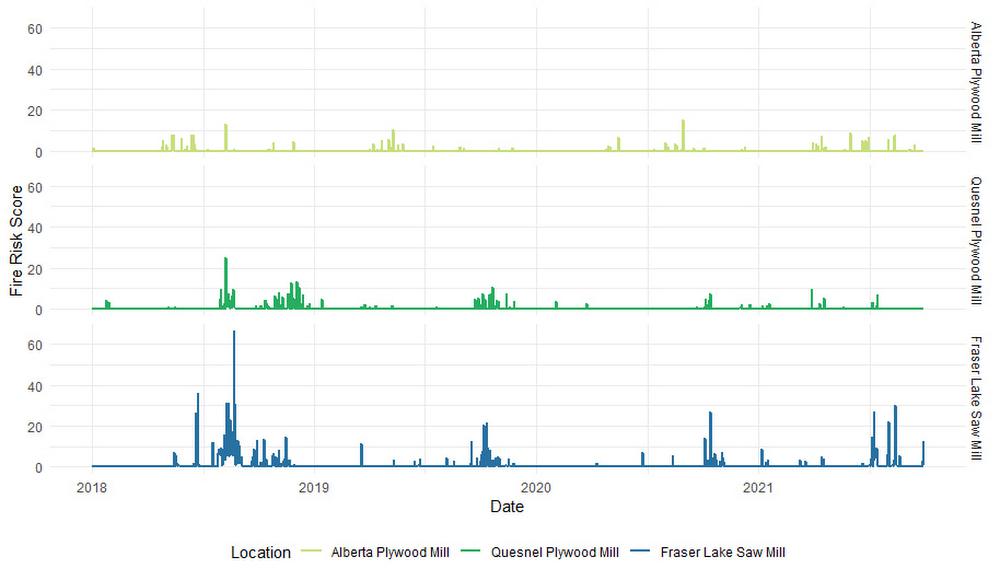
ESGSignals® fire risk score is calculated by combining historical fire events, proximity, and intensity of fire with company asset locations (AssetTracker®). Based on ESGSignals® assessments, the majority of mining assets located in Australia have medium to high exposure to fire risk.
Incorporating asset-level climate risk analytics into portfolio management
Now that we have an understanding of the mechanics of asset-level climate risk, let’s focus on how portfolio managers could incorporate these analytics into their portfolio management processes, including portfolio selection, portfolio monitoring, and company engagement.
Portfolio selection
Portfolio selection can involve various investment tools. In screening, the portfolio manager sets up filtering criteria to select companies for inclusion in, or exclusion from, the portfolio. Asset-level climate risk scores can be included in these screening criteria, along with other financial or non-financial factors.
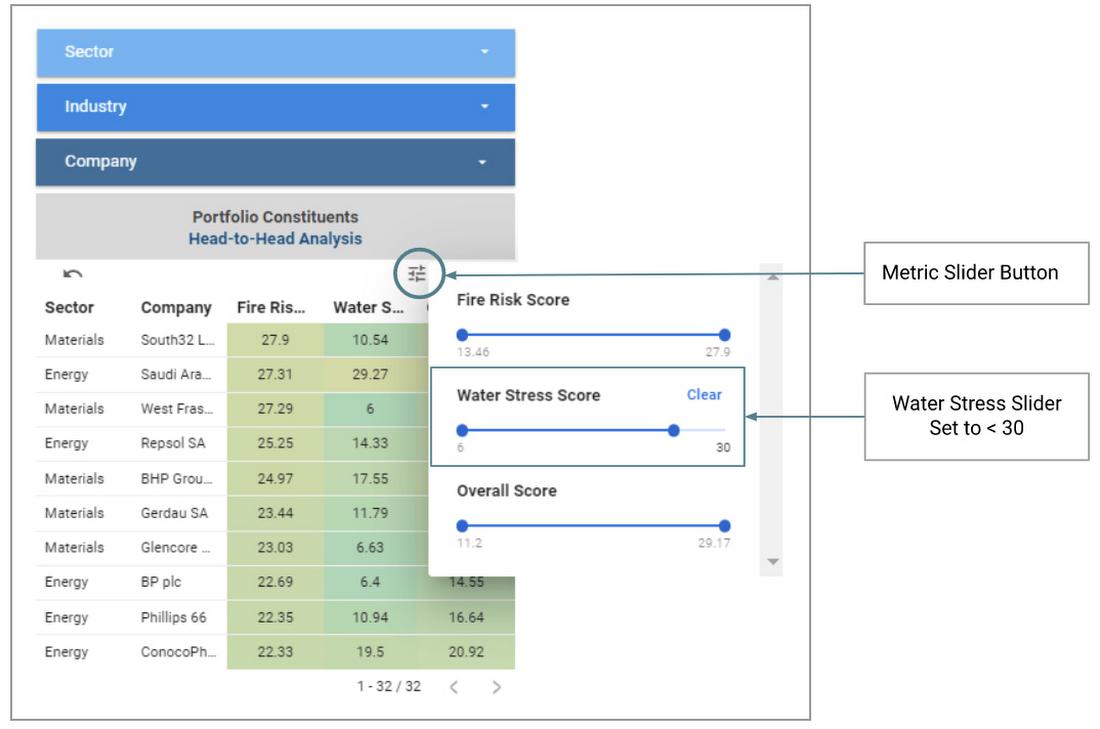
For example, a portfolio manager could search for companies whose average asset-level water stress score is less than 30. This would result in an investment portfolio that has an overall lower risk from water stress than a given benchmark index (see figure below).

Portfolio monitoring
For portfolio monitoring, it’s important to first establish a baseline of physical climate risk for existing holdings within the portfolio. A periodic reporting process that looks for changes in water stress, wildfire, or other physical climate risk metrics can then be created. Any material changes in risk scores would trigger a more detailed analysis to determine the next best action, such as rebalancing the portfolio to meet the target risk profile.

Portfolio engagement
Some portfolio managers engage with companies held in their portfolios, either through shareholder initiatives or by meeting with corporate investor relations teams. For these investors, it’s important to clearly identify the assets with significant exposure to climate risks.
To focus on the locations with the highest opportunity for impact, a portfolio manager could sort the millions of AssetTracker locations by water stress or fire risk score, and engage with companies near the top of these ranked lists. Highlighting mitigation opportunities for these most at-risk assets would be an effective engagement prioritization strategy.

Expanding beyond portfolio management
Applying an asset-level approach to physical climate risk analytics can be helpful beyond the use cases in portfolio management presented above. For example, risk managers in commercial banking could use this methodology to quantify lending risk during underwriting and ongoing loan valuation. Insurance companies could also use these techniques to improve risk assessment and pricing decisions for both new and existing policyholders.
To enable further insights, additional geospatial datasets can be blended with those used in this pattern via BigQuery’s geospatial analytics capabilities. Location information in these datasets, such as points or polygons encoded in a GEOGRAPHY data type, allow them to be combined together with spatial JOINs. For example, a risk analyst could join AssetTracker data with BigQuery public data, such as population information for states, counties, congressional districts, or zip codes available in the Census Bureau US Boundaries dataset.
A cloud-based data environment can help enterprises manage these and other sustainability analytics workflows. Infosys, a Google Cloud partner, provides blueprints and digital data intelligence assets to accelerate the realization of sustainability goals in a secure data collaboration space to connect, collect, correlate information assets such as RS Metrics geospatial data, enterprise data, and digital data to activate ESG intelligence within and across the financial value chain.
Curious to learn more?
To learn more from RS Metrics about analyzing granular asset-level risk metrics with ESGSignals®, you can review their recent and upcoming webinars, or connect directly with them here.
To learn more about sustainability services from Infosys, reach out to the Infosys Sustainability team here. If you’d like a demo of the Infosys ESG Intelligence Cloud solution for Google Cloud, contact the Infosys Data, Analytics & AI team here.
To learn more about the latest strategies and tools that can help solve the tough challenges of climate change across industries, view the sessions on demand from our recent Google Cloud Sustainability Summit.
Special thanks to contributors
The authors would like to thank these Infosys collaborators: Manojkumar Nagdev, Rushiraj Pradeep Jaiswal, Padmaja Vaidyanathan, Anandakumar Kayamboo, Vinod Menon, and Rajan Padmanabhan. We would also like to thank Rashmi Bomiriya, Desi Stoeva, Connie Yaneva, and Randhika H from RS Metrics, and Arun Santhanagopalan, Shane Glass and David Sabater Dinter from Google.
Disclaimer
The information contained on this website is meant for the purposes of information only and is not intended to be investment, legal, tax or other advice, nor is it intended to be relied upon in making an investment or other decision. All content is provided with the understanding that the authors and publishers are not providing advice on legal, economic, investment or other professional issues and services.
By: Maneesh Sagar (CEO, RS Metrics) and Aaman Lamba (Senior Industry Principal, Infosys Data, Analytics & AI) and Jeff Sternberg (Technical Director, Office of the CTO)
Source: Google Cloud Blog
For enquiries, product placements, sponsorships, and collaborations, connect with us at [email protected]. We'd love to hear from you!
Our humans need coffee too! Your support is highly appreciated, thank you!