Iteration and innovation fuel the data-driven culture at Mercado Libre. In our first post, we presented our continuous intelligence approach, which leverages BigQuery and Looker to create a data ecosystem on which people can build their own models and processes.
Using this framework, the Shipping Operations team was able to build a new solution that provided near real-time data monitoring and analytics for our transportation network and enabled data analysts to create, embed, and deliver valuable insights.
From our partners:
The challenge
Shipping operations are critical to success in e-commerce, and Mercado Libre’s process is very complex since our organization spans multiple countries, time zones, and warehouses, and includes both internal and external carriers. In addition, the onset of the pandemic drove exponential order growth, which increased pressure on our shipping team to deliver more while still meeting the 48-hour delivery timelines that customers have come to expect.

This increased demand led to the expansion of fulfillment centers and cross-docking centers, doubling and tripling the nodes of our network (a.k.a. meli-net) in the leading countries where we operate. We also now have the largest electric vehicle fleet in Latin America and operate domestic flights in Brazil and Mexico.
We previously worked with data coming in from multiple sources, and we used APIs to bring it into different platforms based on the use case. For real-time data consumption and monitoring, we had Kibana, while historical data for business analysis was piped into Teradata. Consequently, the real-time Kibana data and the historical data in Teradata were growing in parallel, without working together. On one hand, we had the operations team using real-time streams of data for monitoring, while on the other, business analysts were building visualizations based on the historical data in our data warehouse.
This approach resulted in a number of problems:
- The operations team lacked visibility and required support to build their visualizations. Specialized BI teams became bottlenecks.
- Maintenance was needed, which led to system downtime.
- Parallel solutions were ungoverned (the ops team used an Elastic database to store and work with attributes and metrics) with unfriendly backups and data bounded for a period of time.
- We couldn’t relate data entities as we do with SQL.
Striking a balance: real-time vs. historical data
We needed to be able to seamlessly navigate between real-time and historical data. To address this need, we decided to migrate the data to BigQuery, knowing we would leverage many use cases at once with Google Cloud.
Once we had our real-time and historical data consolidated within BigQuery, we had the power to make choices about which datasets needed to be made available in near real-time and which didn’t. We evaluated the use of analytics with different time windows tables from the data streams instead of the real-time logs visualization approach. This enabled us to serve near real-time and historical data utilizing the same origin.
We then modeled the data using LookML, Looker’s reusable modeling language based on SQL, and consumed the data through Looker dashboards and Explores. Because Looker queries the database directly, our reporting mirrored the near real-time data stored in BigQuery. Finally, in order to balance near real-time availability with overall consumption costs, we analyzed key use cases on a case-by-case basis to optimize our resource usage.
This solution prevented us from having to maintain two different tools and featured a more scalable architecture. Thanks to the services of GCP and the use of BigQuery, we were able to design a robust data architecture that ensures the availability of data in near real-time.
Streaming data with our own Data Producer Model: from APIs to BigQuery
To make new data streams available, we designed a process which we call the “Data Producer Model” (“Modelo Productor de Datos” or MPD) where functional business teams can serve as data creators in charge of generating data streams and publishing them as related information assets we call “data domains”. Using this process, the new data comes in via JSON format, which is streamed into BigQuery. We then use a 3-tiered transformation process to convert that JSON into a partitioned, columnar structure.
To make these new data sets available in Looker for exploration, we developed a Java utility app to accelerate the development of LookML and make it even more fun for developers to create pipelines.
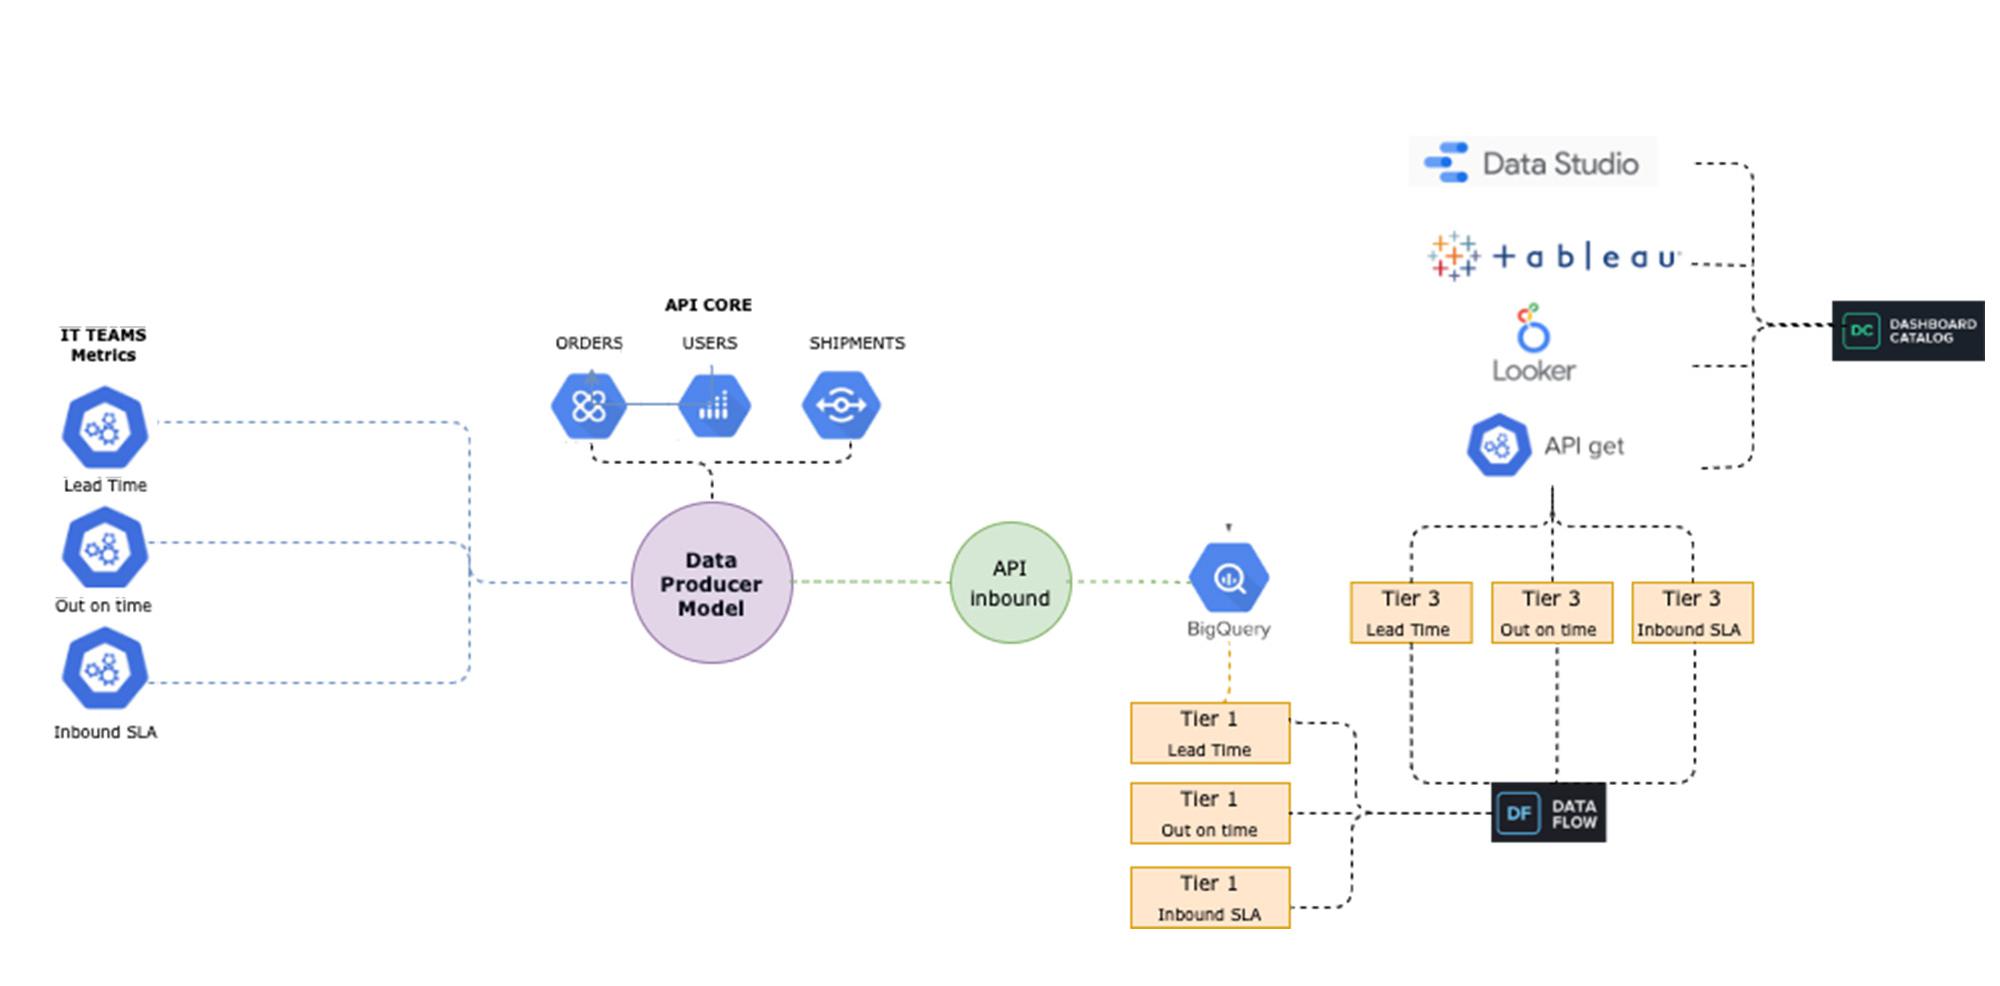

The complete “MPD” solution results in different entities being created in BigQuery with minimal manual intervention. Using this process, we have been able to automate the following:
- The creation of partitioned, columnar tables in BigQuery from JSON samples
- The creation of authorized views in a different GCP BigQuery project (for governance purposes)
- LookML code generation for Looker views
- Job orchestration in a chosen time window
By using this code-based incremental approach with LookML, we were able to incorporate techniques that are traditionally used in DevOps for software development, such as using Lams to validate LookML syntax as a part of the CI process and testing all our definitions and data with Spectacles before they hit production. Applying these principles to our data and business intelligence pipelines has strengthened our continuous intelligence ecosystem. Enabling exploration of that data through Looker and empowering users to easily build their own visualizations has helped us to better engage with stakeholders across the business.
The new data architecture and processes that we have implemented have enabled us to keep up with the growing and ever-changing data from our continuously expanding shipping operations. We have been able to empower a variety of teams to seamlessly develop solutions and manage third party technologies, ensuring that we always know what’s happening – and more critically – enabling us to react in a timely manner when needed.
Outcomes from improving shipping operations:
Today, data is being used to support decision-making in key processes, including:
- Carrier Capacity Optimization
- Outbound Monitoring
- Air Capacity Monitoring
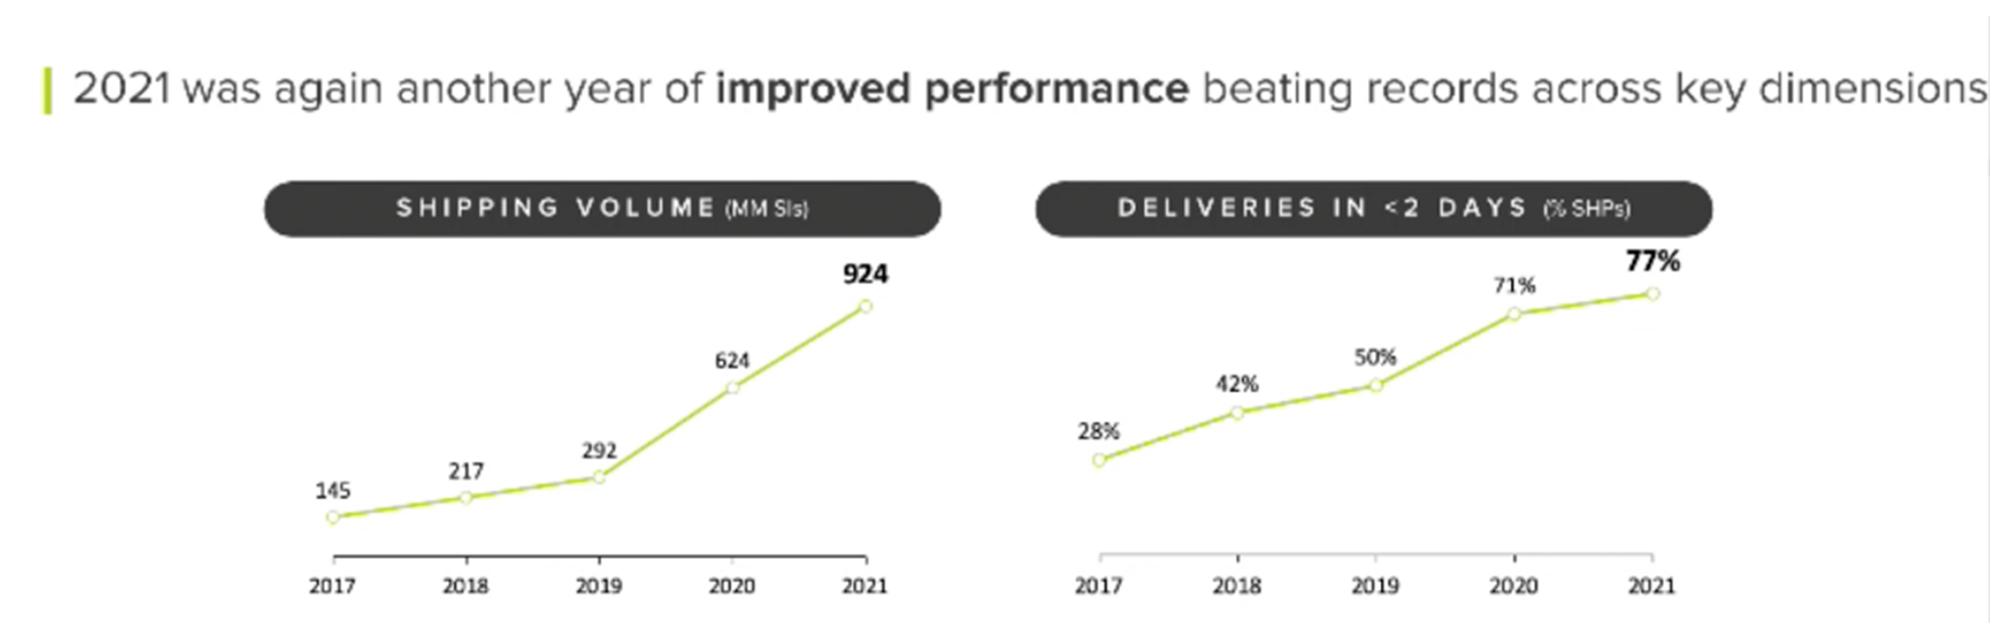
This data-driven approach helps us to better serve you -and everyone- who expects to receive their packages on-time according to our delivery promise. We can proudly say that we have improved both our coverage and speed, delivering 79% of our shipments in less than 48 hours in the first quarter of 2022.
Here is a sneak peek into the data assets that we use to support our day-to-day decision making:
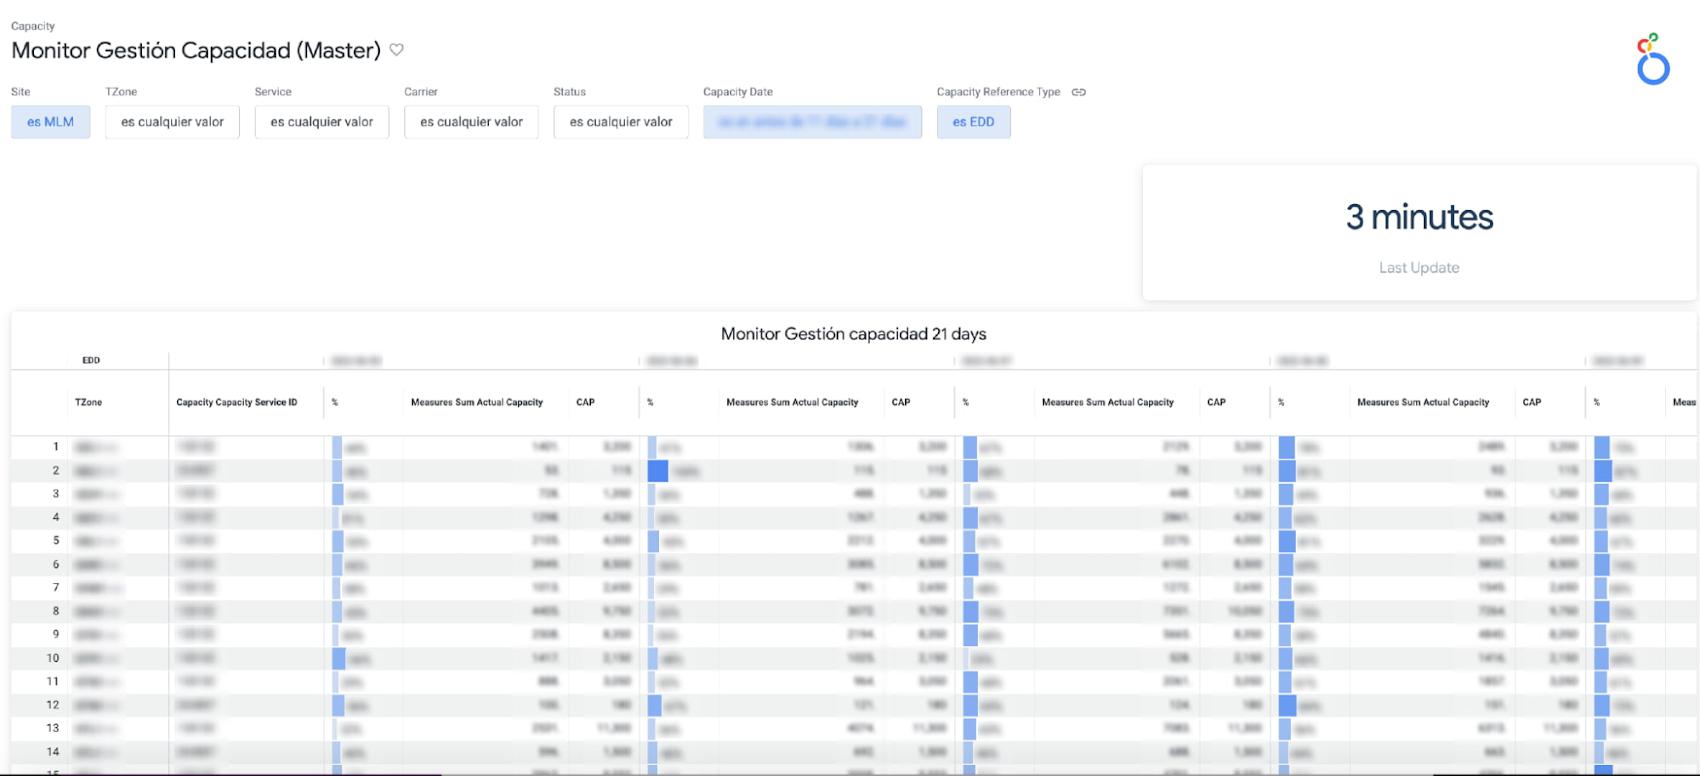
a. Carrier Capacity: Allows us to monitor the percentage of network capacity utilized across every delivery zone and identify where delivery targets are at risk in almost real time.

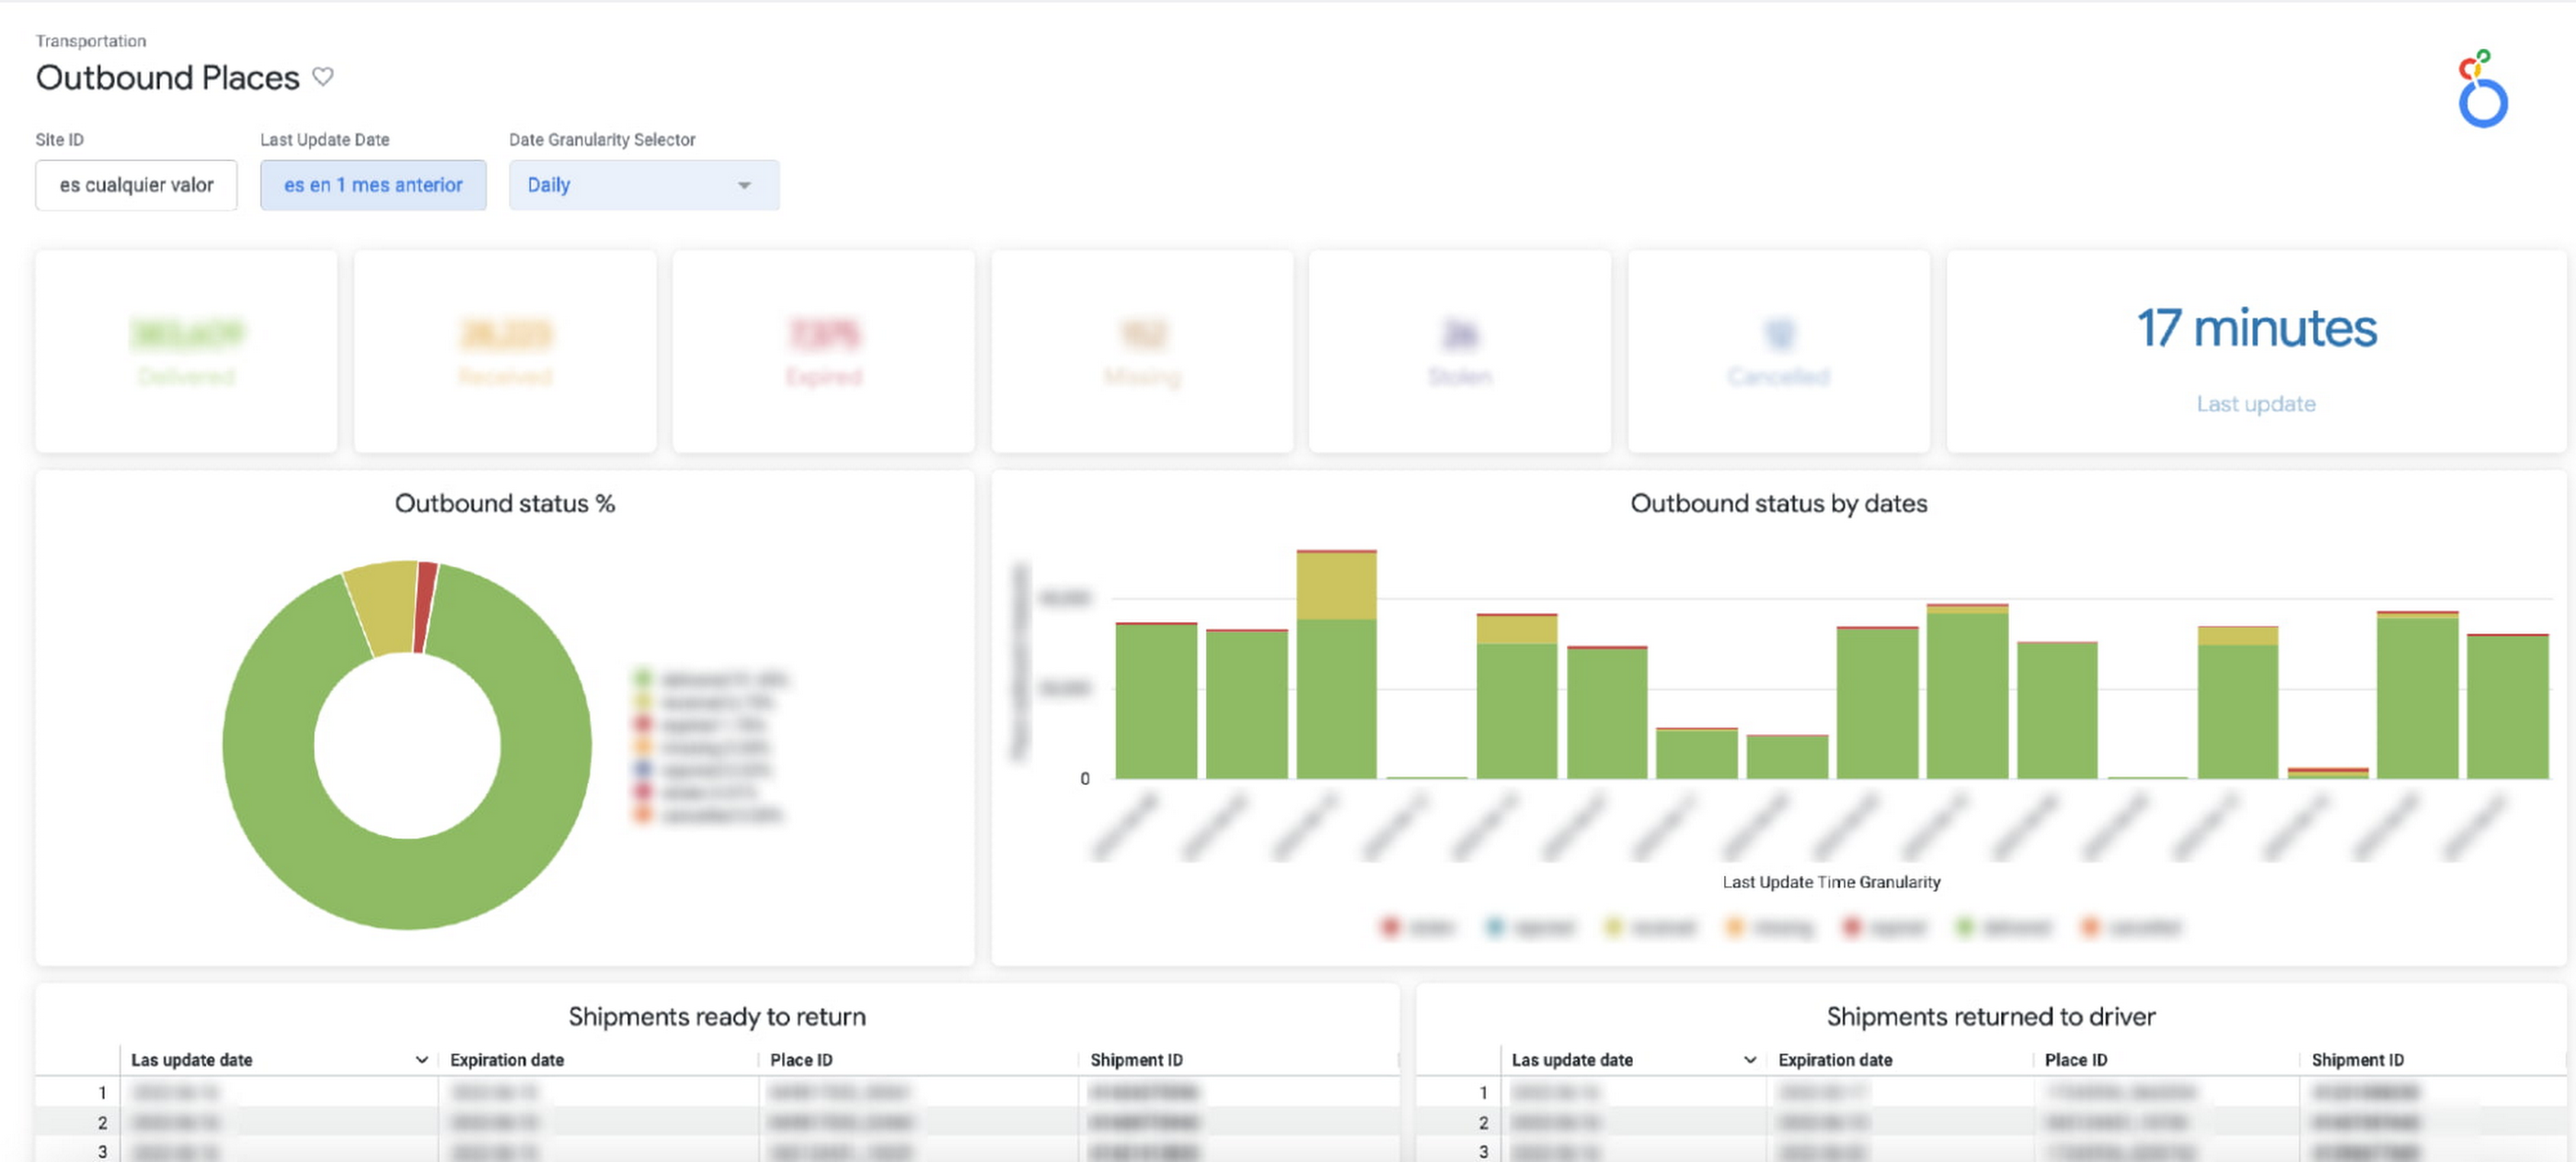
b. Outbound Places Monitoring: Consolidates the number of shipments that are destined for a place (the physical points where a seller picks up a package), enabling us to both identify places with lower delivery efficiency and drill into the status of individual shipments.

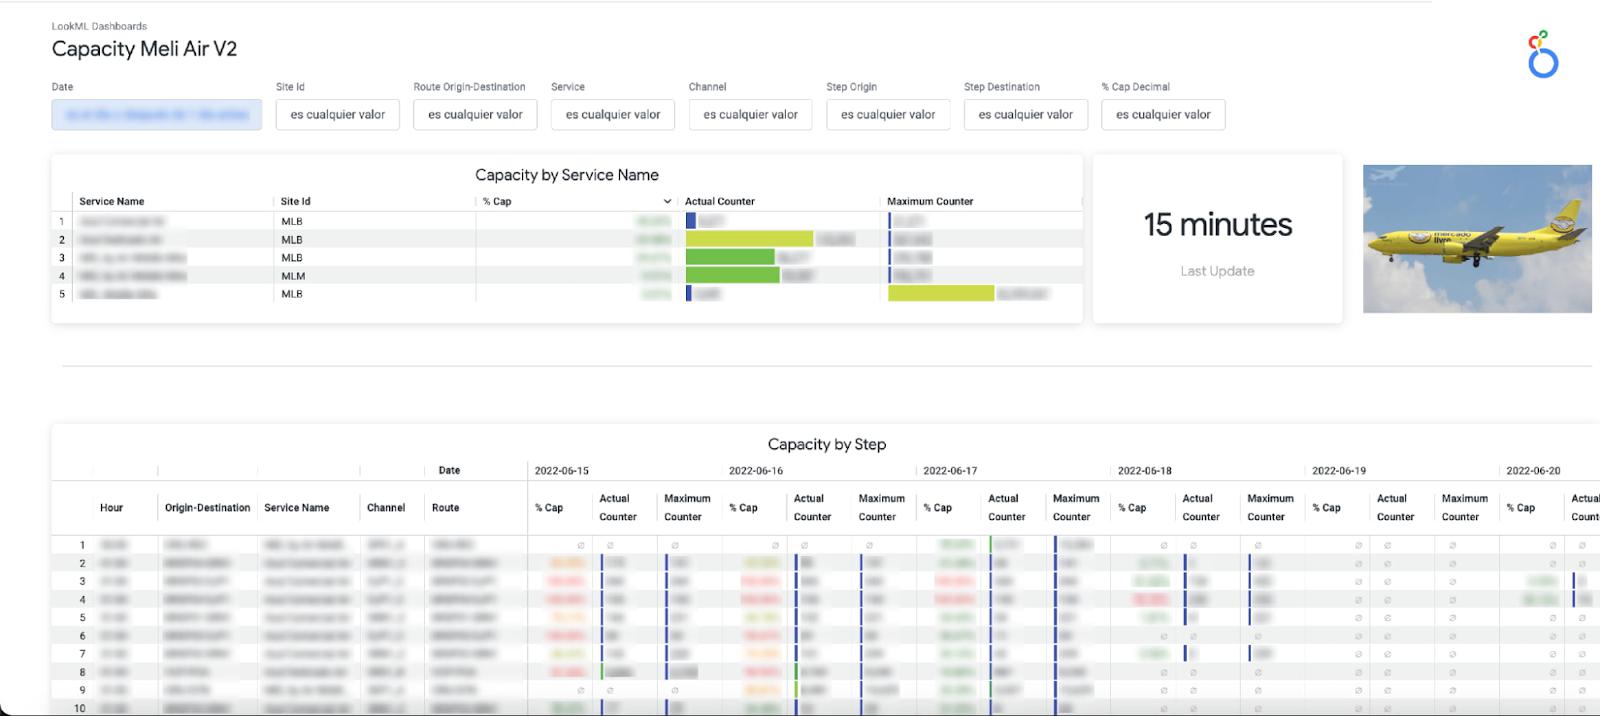
c. The Air Capacity Monitoring: Provides capacity usage monitoring for our aircrafts running each of our shipping routes.

Costs into the equation
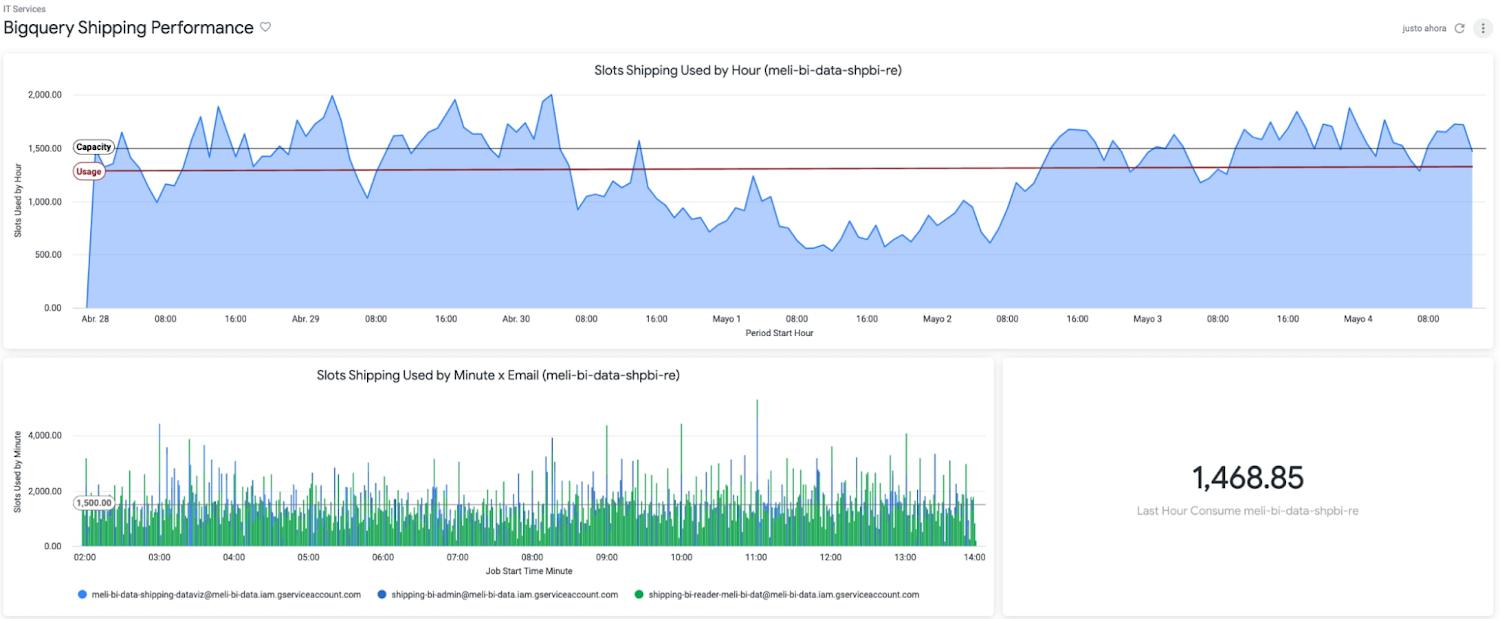
The combination of BigQuery and Looker also showed us something we hadn’t seen before: overall cost and performance of the system. Traditionally, developers maintained focus on metrics like reliability and uptime without factoring in associated costs.
By using BigQuery’s information schema, Looker Blocks, and the export of BigQuery logs, we have been able to closely track data consumption, quickly detect underperforming SQL and errors, and make adjustments to optimize our usage and spend.
Based on that, we know the Looker Shipping Ops dashboards generate a concurrency of more than 150 queries, which we have been able to optimize by taking advantage of BigQuery and Looker caching policies.

The challenges ahead
Using BigQuery and Looker has enabled us to solve numerous data availability and data governance challenges: single point access to near real-time data and to historical information, self-service analytics & exploration for operations and stakeholders across different countries & time zones, horizontal scalability (with no maintenance), and guaranteed reliability and uptime (while accounting for costs), among other benefits.
However, in addition to having the right technology stack and processes in place, we also need to enable every user to make decisions using this governed, trusted data. To continue achieving our business goals, we need to democratize access not just to the data but also to the definitions that give the data meaning. This means incorporating our data definitions with our internal data catalog and serving our LookML definitions to other data visualizations tools like Data Studio, Tableau or even Google Sheets and Slides so that users can work with this data through whatever tools they feel most comfortable using.
If you would like a more indepth look at how we made new data streams available from a process we designed called the “Data Producer Model” (“Modelo Productor de Datos” or MPD) register to attend our webcast on August 31.
While learning and adopting new technologies can be a challenge, we are excited to tackle this next phase, and we expect our users will be too, thanks to a curious and entrepreneurial culture. Are our teams ready to face new changes? Are they able to roll out new processes and designs? We’ll go deep on this in our next post.
By: Pablo Fernández Osorio (Data & Analytics Senior Mgr, Mercado Libre)
Source: Google Cloud Blog
For enquiries, product placements, sponsorships, and collaborations, connect with us at [email protected]. We'd love to hear from you!
Our humans need coffee too! Your support is highly appreciated, thank you!