This blog is the fourth in a series and it follows the blog Analyze Pacemaker events in Cloud Logging, which describes how you can install and configure Google Cloud Ops Agent to stream Pacemaker logs of all your high availability clusters to Cloud Logging. You can analyze Pacemaker events happening to any of your clusters in one central place. But what if you don’t have this agent installed and want to know what happened to your cluster?
Let’s look at this open source python script logparser, which will help you consolidate relevant Pacemaker logs from cluster nodes and filter the log entries for critical events such as fencing or resource failure. It takes below log files as input files and generates an output file of log entries in chronological order for critical events.
From our partners:
- System log such as /var/log/messages
- Pacemaker logs such as /var/log/pacemaker.log and /var/log/corosync/corosync.log
- hb_report in SUSE
- sosreport in RedHat
How to use this script?
The script is available to download from this GitHub repository and supports multiple platforms.
Prerequisites
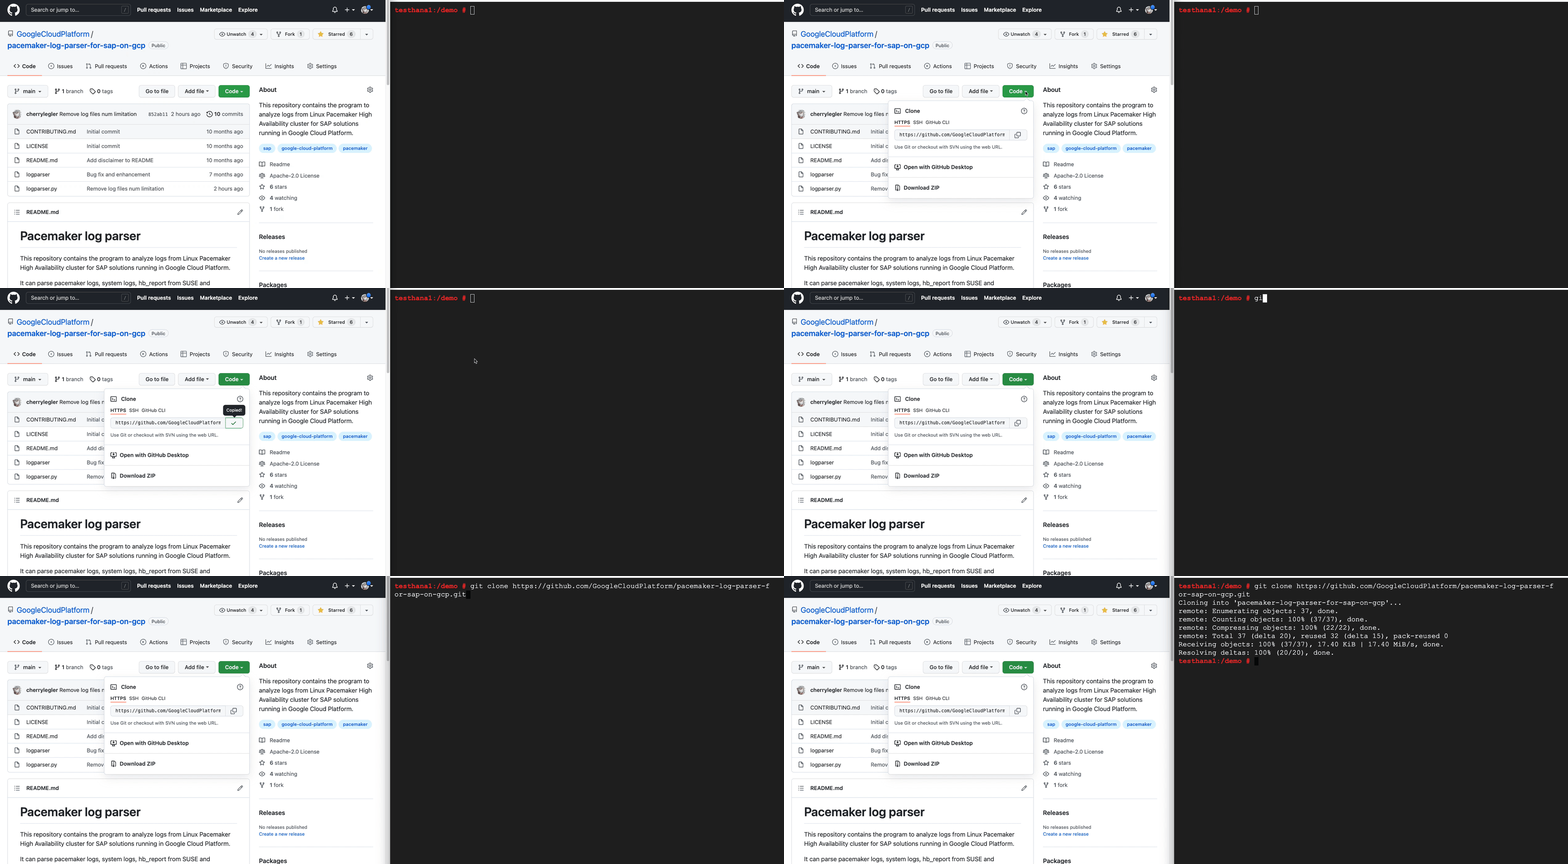
The program requires Python 3.6+. It can run on Linux, Windows and MacOS. As the first step, install or update your Python environment. Second, clone the GitHub repository as shown below.
Run the script
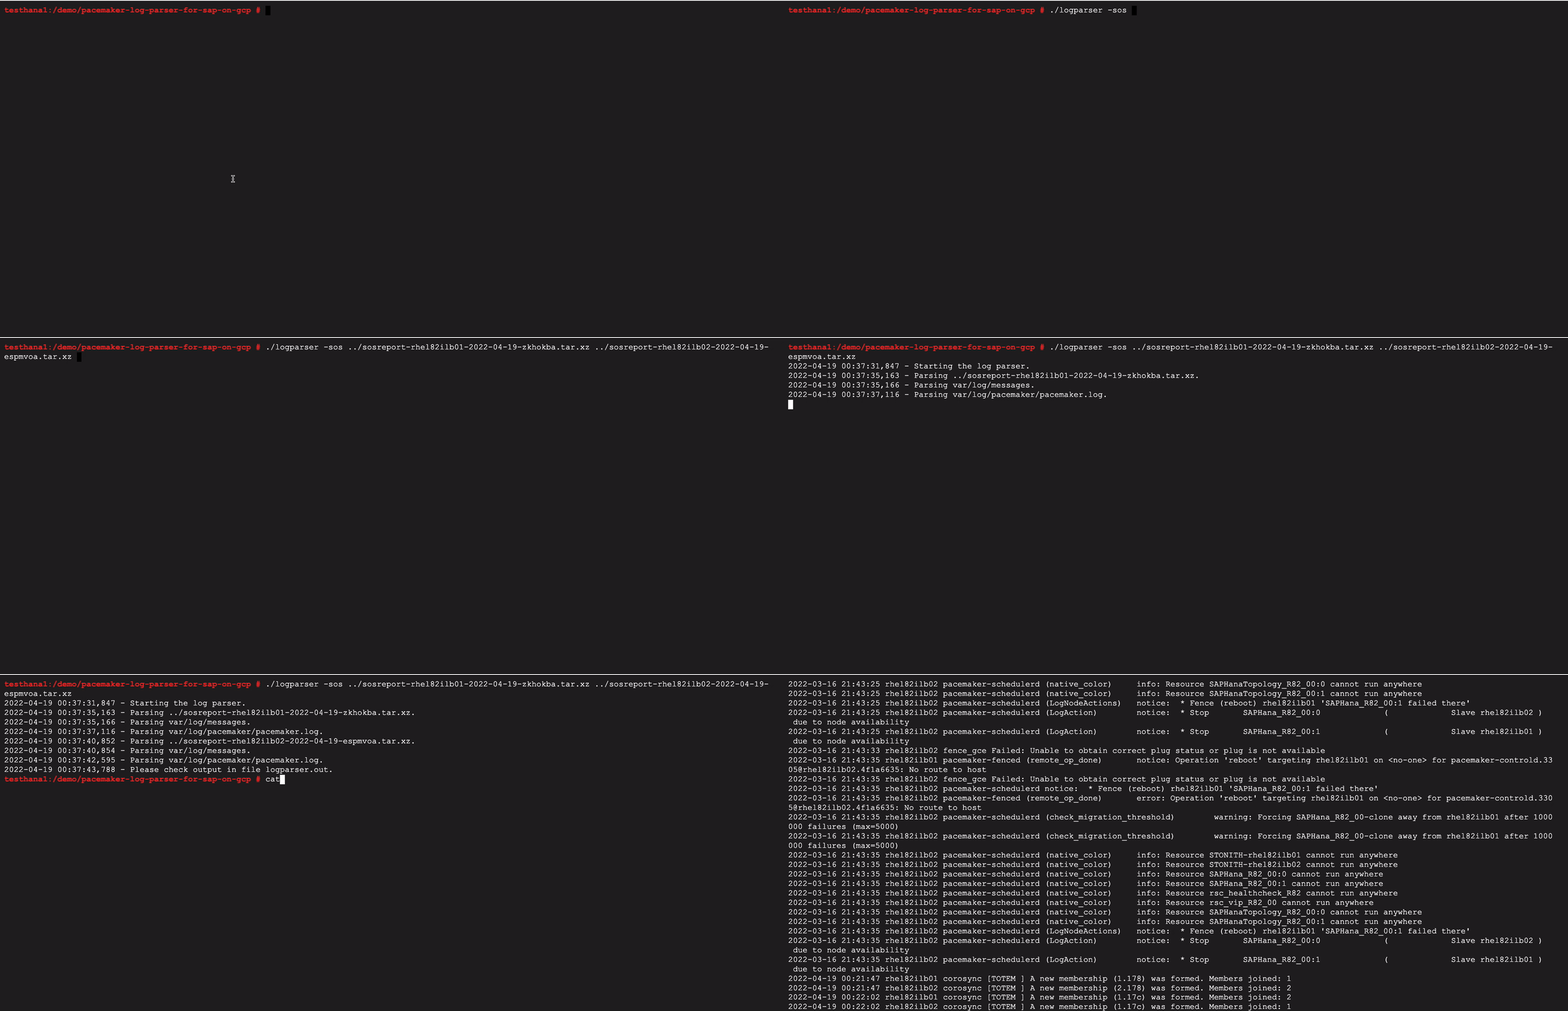
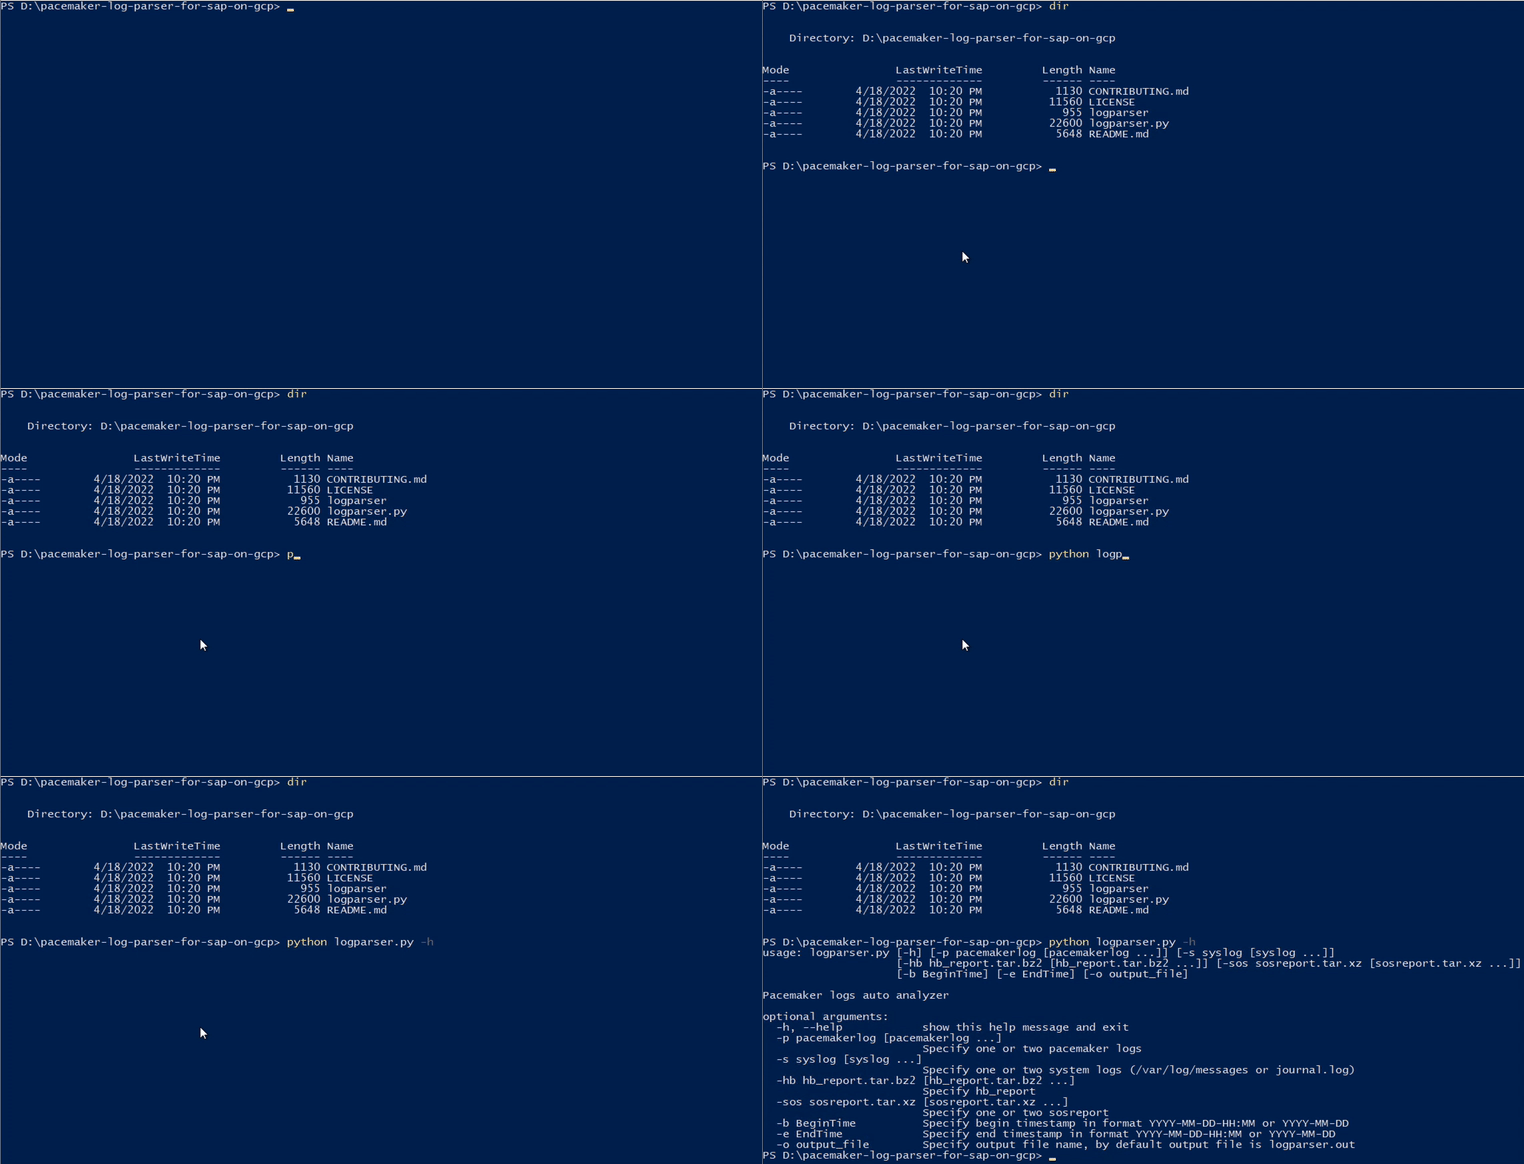
See ‘-h’ for help. Specify the input log files, optional time range or output file name. By default, the output file is ‘logparser.out’ in the current directory.
The hb_report is a utility provided by SUSE to capture all relevant Pacemaker logs in one package. If ssh login without password is set up between the cluster nodes, it should gather all information from all nodes. If not, collect the hb_report on each cluster node.
The sosreport is a similar utility provided by RedHat to collect system log files, configuration details and system information. Pacemaker logs are also collected. Collect the sosreport on each cluster node.
You can also parse single system logs or Pacemaker logs.
In Windows, execute the Python file logparser.py instead.
Next, we need to analyze the output information of the log parser results.
Understanding the Output Information
The output log may contain a variety of information, including but not limited to fencing actions, resources actions, failures, or Corosync subsystem events.
Fencing action reason and result
The example below shows a fencing (reboot) action targeting a cluster node because the node left the cluster. The subsequent log entry shows the fencing operation is successful (OK).
2021-03-26 03:10:38 node1 pengine: notice: LogNodeActions: * Fence (reboot) node2 'peer is no longer part of the cluster'2021-03-26 03:10:57 node1 stonith-ng: notice: remote_op_done: Operation 'reboot' targeting node1 on node2 for [email protected]: OK
Pacemaker actions to manage cluster resources
The example below illustrates multiple actions affecting the cluster resources, such as actions moving resources from one cluster node to another, or an action stopping a resource on a specific cluster node.
2021-03-26 03:10:38 node1 pengine: notice: LogAction: * Move rsc_vip_int-primary ( node2 -> node1 )2021-03-26 03:10:38 node1 pengine: notice: LogAction: * Move rsc_ilb_hltchk ( node2 -> node1 )2021-03-26 03:10:38 node1 pengine: notice: LogAction: * Stop rsc_SAPHanaTopology_SID_HDB00:1 ( node2 ) due to node availability
Failed resource operations
Pacemaker manages cluster resources by calling resource operations such as monitor, start or stop, which are defined in corresponding resource agents (shell or Python scripts). The log parser filters log entries of failed operations. The example below shows a monitor operation that failed because the virtual IP resource is not running.
2020-07-23 13:11:44 node2 crmd: info: process_lrm_event: Result of monitor operation for rsc_vip_gcp_ers on node2: 7 (not running)
Resource agent, fence agent warnings and errors
A resource agent or fence agent writes detailed logs for operations. When you observe resource operation failure, the agent logs can help identify the root cause. The log parser filters the ERROR logs for all agents. Additionally, it filters WARNING logs for the SAPHana agent.
2021-03-16 14:12:31 node1 SAPHana(rsc_SAPHana_SID_HDB01): ERROR: ACT: HANA SYNC STATUS IS NOT 'SOK' SO THIS HANA SITE COULD NOT BE PROMOTED2021-01-15 07:15:05 node1 gcp:stonith: ERROR - gcloud command not found at /usr/bin/gcloud2021-02-08 17:05:30 node1 SAPInstance(rsc_sap_SID_ASCS10): ERROR: SAP instance service msg_server is not running with status GRAY !
Corosync communication error or failure
Corosync is the messaging layer that the cluster nodes use to communicate with each other. Failure in Corosync communication between nodes may trigger a fencing action.
The example below shows a Corosync message being retransmitted multiple times and eventually reporting an error that the other cluster node left the cluster.
2021-11-25 03:19:33 node2 corosync: message repeated 214 times: [ [TOTEM ] Retransmit List: 31609]2021-11-25 03:19:34 node2 corosync [TOTEM ] FAILED TO RECEIVE2021-11-25 03:19:58 23:28:32 node2 corosync [TOTEM ] A new membership (10.236.6.30:272) was formed. Members left: 12021-11-25 03:19:58 node2 corosync [TOTEM ] Failed to receive the leave message. failed: 1
This next example shows that a Corosync TOKEN was not received within the defined time period and eventually Corosync reported an error that the other cluster node left the cluster.
2021-11-25 03:19:32 node1 corosync: [TOTEM ] A processor failed, forming new configuration.2021-11-25 03:19:33 node1 corosync: [TOTEM ] Failed to receive the leave message. failed: 2
Reach migration threshold and force resource off
When the number of failures of a resource reaches the defined migration threshold (parameter migration-threshold), the resource is forced to migrate to another cluster node.
check_migration_threshold: Forcing rsc_name away from node1 after 1000000 failures (max=5000)
When a resource fails to start on a cluster node, the number of failures will be updated to INFINITY, which implicitly reaches the migration threshold and forces a resource migration. If there is any location constraint preventing the resource to run on the other cluster nodes or no other cluster nodes are available, the resource is stopped and cannot run anywhere.
2021-03-15 23:28:33 node1 pengine: info: native_color: Resource STONITH-sap-sid-sec cannot run anywhere2021-03-15 23:28:33 node1 pengine: info: native_color: Resource rsc_vip_int_failover cannot run anywhere2021-03-15 23:28:33 node1 pengine: info: native_color: Resource rsc_vip_gcp_failover cannot run anywhere2021-03-15 23:28:33 node1 pengine: info: native_color: Resource rsc_sap_SID_ERS90 cannot run anywhere
Location constraint added due to manual resource movement
All location constraints with prefix ‘cli-prefer’ or ‘cli-ban’ are added implicitly when a user triggers either a cluster resource move or ban command. These constraints should be cleared after the resource movement, as they restrict the resource so it only runs on a certain node. The example below shows a ‘cli-ban’ location constraint was created, and a ‘cli-prefer’ location constraint was deleted.
2021-02-11 10:49:43 node2 cib: info: cib_perform_op: ++ /cib/configuration/constraints: <rsc_location id="cli-ban-grp_sap_cs_sid-on-node1" rsc="grp_sap_cs_sid" role="Started" node="node1" score="-INFINITY"/>2021-02-11 11:26:29 node2 stonith-ng: info: update_cib_stonith_devices_v2: Updating device list from the cib: delete rsc_location[@id='cli-prefer-grp_sap_cs_sid']
Cluster/Node/Resource maintenance/standby/manage mode change
The log parser filters log entries when any maintenance commands are issued on the cluster, cluster nodes or resources. The examples below show the cluster maintenance mode was enabled, and a node was set to standby.
(cib_perform_op) info: + /cib/configuration/crm_config/cluster_property_set[@id='cib-bootstrap-options']/nvpair[@id='cib-bootstrap-options-maintenance-mode']: @value=true(cib_perform_op) info: + /cib/configuration/nodes/node[@id='2']/instance_attributes[@id='nodes-2']/nvpair[@id='nodes-2-standby']: @value=on
Conclusion
This Pacemaker log parser can give you one simplified view of critical events in your High Availability cluster. If further support is needed from the Google Cloud Customer Care Team, follow this guide to collect the diagnostics files and open a support case.
If you are interested in learning more about running SAP on Google Cloud with Pacemaker, read the previous blogs in this series here:
By: Cherry Legler (Senior Technical Solution Engineer)
Source: Google Cloud Blog
For enquiries, product placements, sponsorships, and collaborations, connect with us at [email protected]. We'd love to hear from you!
Our humans need coffee too! Your support is highly appreciated, thank you!


