Lightweight Kubernetes, known as K3s, is an installation of Kubernetes half the size in terms of memory footprint.
Do you need to monitor your nodes running K3s to know the status of your cluster? Do you also need to know how your pods perform, the resources they consume, as well as network traffic? In this article, I will show you how to monitor K3s with Telegraf and InfluxDB Cloud.
From our partners:
I run a blog and a few other resources on Kubernetes. Specifically, these run in a cluster of three nodes in DigitalOcean that run K3s, and I use Telegraf and InfluxDB to monitor everything.
I’m going to demonstrate how to monitor the cluster to make sure that everything is running as expected and how to identify something if it is not.
To monitor the cluster I use two components:
InfluxDB Cloud: It’s ideal to do monitoring from the outside because if we do it from the inside and the node goes down, then so does the monitoring solution, and that doesn’t make any sense. You can get a free InfluxDB account here: https://cloud2.influxdata.com/signup/
Next, we need to install a Helm chart from Telegraf, specifically this one, because it does not have Docker engine support, which if you run K3s, doesn’t need it.
Configuring InfluxDB Cloud
The first thing we must do is create an account in InfluxDB Cloud. Next, we go to the Data section, click on Buckets, and then on Create Bucket.

Name the bucket and click on Create.

This is what our list of buckets should look like. After successfully creating the bucket, we create an access token to be able to write data to that bucket. To do that we go to the Tokens tab.

In this section, we click on Generate Token and choose the Read/Write Token option.

We specify a name, choose the bucket we want to associate with this token, and click on Save.

Once this is done, the new token appears in the token list.

To finish this part, we are going to need our Org ID and the URL to point our Telegraf to.
The Org ID is the email you used to sign up for InfluxDB Cloud. I get the URL from the address bar. In my case, when I set up my InfluxDB Cloud account, I chose the western United States. So my URL looks like this:
https://us-west-2-1.aws.cloud2.influxdata.com
Now that we configured InfluxDB Cloud, we need to configure the nodes.
As I mentioned above, we are going to use a Helm Chart. I modified this Helm Chart to adapt to K3s, because by default it tries to monitor Docker, which isn’t used in this Kubernetes distribution.
If you don’t have Helm installed, you can install it by running this command:
$ <span class="token function">curl</span> https://raw.githubusercontent.com/helm/helm/master/scripts/get-helm-3 <span class="token operator">|</span><span class="token function">bash</span>Once installed, download the values.yaml file here.
You can also grab the raw file and download it directly to the master node with a wget.
$ wget https<span class="token punctuation">:</span>//raw.githubusercontent.com/xe<span class="token punctuation">-</span>nvdk/awesome<span class="token punctuation">-</span>helm<span class="token punctuation">-</span>charts/main/telegraf<span class="token punctuation">-</span>ds<span class="token punctuation">-</span>k3s/values.yamlNow, we have to modify this file a bit. We need to open it and modify the Output section. By default the file looks like this:
<span class="token title important"><span class="token punctuation">##</span> Exposed telegraf configuration</span>
<span class="token title important"><span class="token punctuation">##</span> ref: https://docs.influxdata.com/telegraf/v1.13/administration/configuration/</span>
config:
  <span class="token title important"><span class="token punctuation">#</span> global_tags:</span>
  <span class="token title important"><span class="token punctuation">#</span>   cluster: "mycluster"</span>
  agent:
    interval: "10s"
    round_interval: true
    metric_batch_size: 1000
    metric_buffer_limit: 10000
    collection_jitter: "0s"
    flush_interval: "10s"
    flush_jitter: "0s"
    precision: ""
    debug: false
    quiet: false
    logfile: ""
    hostname: "$HOSTNAME"
    omit_hostname: false
  outputs:
    <span class="token list punctuation">-</span> influxdb:
        urls:
          <span class="token list punctuation">-</span> "http://influxdb.monitoring.svc:8086"
        database: "telegraf"
        retention_policy: ""
        timeout: "5s"
        username: ""
        password: ""
        user_agent: "telegraf"
        insecure_skip_verify: false
  monitor_self: false
But since we are going to use InfluxDB Cloud, we must make some adjustments. The modified version will look something like this:
...

<span class="token title important"><span class="token punctuation">##</span> Exposed telegraf configuration</span>
<span class="token title important"><span class="token punctuation">##</span> ref: https://docs.influxdata.com/telegraf/v1.13/administration/configuration/</span>
config:
  <span class="token title important"><span class="token punctuation">#</span> global_tags:</span>
  <span class="token title important"><span class="token punctuation">#</span>   cluster: "mycluster"</span>
  agent:
    interval: "1m"
    round_interval: true
    metric_batch_size: 1000
    metric_buffer_limit: 10000
    collection_jitter: "0s"
    flush_interval: "10s"
    flush_jitter: "0s"
    precision: ""
    debug: false
    quiet: false
    logfile: ""
    hostname: "$HOSTNAME"
    omit_hostname: false
  outputs:
    <span class="token list punctuation">-</span> influxdb_v2:
        urls:
          <span class="token list punctuation">-</span> "https://us-west-2-1.aws.cloud2.influxdata.com"
        bucket: "kubernetes"
        organization: "[email protected]"
        token: "WIX6Fy-v10zUIag_dslfjasfljadsflasdfjasdlñjfasdlkñfj=="
        timeout: "5s"
        insecure_skip_verify: false
  monitor_self: false
If we need to adjust other values, like the collection interval, you can do it by changing the interval value. For example, I don’t need the data every 10 seconds, so I changed it to 1 minute.
Now we come to the moment of truth! We are going to install the Helm Chart and see if everything works as expected. Depending on your K3s configuration, you might need to pass the cluster configuration as a KUBECONFIG environment variable.
$ exportKUBECONFIG<span class="token operator">=</span><span class="token operator">/</span>etc<span class="token operator">/</span>rancher<span class="token operator">/</span>k3s<span class="token operator">/</span>k3s<span class="token punctuation">.</span>yamlOnce that’s done, we’re going to add the Awesome-Helm-Charts repo.
$ helm repo add awesome<span class="token operator">-</span>helm<span class="token operator">-</span>charts https<span class="token operator">:</span><span class="token operator">/</span><span class="token operator">/</span>xe<span class="token operator">-</span>nvdk<span class="token punctuation">.</span>github<span class="token punctuation">.</span>io<span class="token operator">/</span>awesome<span class="token operator">-</span>helm<span class="token operator">-</span>charts<span class="token operator">/</span>Then we update the content of the repos that we configured.
$ helm repo updateFinally, we’ll install the repo, passing it the configuration we just modified in the values.yaml file.
$ helm upgrade <span class="token operator">--</span>install telegraf<span class="token operator">-</span>ds<span class="token operator">-</span>k3s <span class="token operator">-</span>f values<span class="token punctuation">.</span>yaml awesome<span class="token operator">-</span>helm<span class="token operator">-</span>charts<span class="token operator">/</span>telegraf<span class="token operator">-</span>ds<span class="token operator">-</span>k3sThe terminal should return something similar to this:
Release "telegraf-ds-k3s" does not exist. Installing it now.
NAME: telegraf-ds-k3s
LAST DEPLOYED: Fri Jun 25 22:47:22 2021
NAMESPACE: default
STATUS: deployed
REVISION: 1
TEST SUITE: None
NOTES:
To open a shell session in the container running Telegraf run the following:

<span class="token list punctuation">-</span> kubectl exec -i -t --namespace default $(kubectl get pods --namespace default -l app.kubernetes.io/name=telegraf-ds -o jsonpath='{.items[0].metadata.name}') /bin/sh

To tail the logs for a Telegraf pod in the Daemonset run the following:

<span class="token list punctuation">-</span> kubectl logs -f --namespace default $(kubectl get pods --namespace default -l app.kubernetes.io/name=telegraf-ds -o jsonpath='{ .items[0].metadata.name }')

To list the running Telegraf instances run the following:

<span class="token list punctuation">-</span> kubectl get pods --namespace default -l app.kubernetes.io/name=telegraf-ds -w
This output shows that the Helm chart deployed successfully. Keep in mind that this is a DaemonSet, which automatically installs the Helm Chart on each of the nodes in this cluster.
To check that everything is running properly use the following command:
$ kubectl <span class="token keyword">get</span> podsWe see that our pod is alive and kicking.
<span class="token constant">AME</span>                    <span class="token constant">READY</span>   <span class="token constant">STATUS</span>    <span class="token constant">RESTARTS</span>   <span class="token constant">AGE</span>
telegraf<span class="token operator">-</span>ds<span class="token operator">-</span>k3s<span class="token operator">-</span>w8qhc   <span class="token number">1</span><span class="token operator">/</span><span class="token number">1</span>     Running   <span class="token number">0</span>          2m29s
If you want to make sure that the log is working as expected, then run:
$ kubectl logs <span class="token operator">-</span>f telegraf<span class="token operator">-</span>ds<span class="token operator">-</span>k3s<span class="token operator">-</span>w8qhcThe terminal should output something like this:
<span class="token number">2021</span><span class="token operator">-</span><span class="token number">06</span><span class="token operator">-</span>26T02<span class="token operator">:</span><span class="token number">55</span><span class="token operator">:</span>22Z <span class="token constant">I</span><span class="token operator">!</span> Starting Telegraf <span class="token number">1.18</span><span class="token number">.3</span>
<span class="token number">2021</span><span class="token operator">-</span><span class="token number">06</span><span class="token operator">-</span>26T02<span class="token operator">:</span><span class="token number">55</span><span class="token operator">:</span>22Z <span class="token constant">I</span><span class="token operator">!</span> Using config file<span class="token operator">:</span> <span class="token operator">/</span>etc<span class="token operator">/</span>telegraf<span class="token operator">/</span>telegraf<span class="token punctuation">.</span>conf
<span class="token number">2021</span><span class="token operator">-</span><span class="token number">06</span><span class="token operator">-</span>26T02<span class="token operator">:</span><span class="token number">55</span><span class="token operator">:</span>22Z <span class="token constant">I</span><span class="token operator">!</span> Loaded inputs<span class="token operator">:</span> cpu disk diskio kernel kubernetes mem net processes swap system
<span class="token number">2021</span><span class="token operator">-</span><span class="token number">06</span><span class="token operator">-</span>26T02<span class="token operator">:</span><span class="token number">55</span><span class="token operator">:</span>22Z <span class="token constant">I</span><span class="token operator">!</span> Loaded aggregators<span class="token operator">:</span>
<span class="token number">2021</span><span class="token operator">-</span><span class="token number">06</span><span class="token operator">-</span>26T02<span class="token operator">:</span><span class="token number">55</span><span class="token operator">:</span>22Z <span class="token constant">I</span><span class="token operator">!</span> Loaded processors<span class="token operator">:</span>
<span class="token number">2021</span><span class="token operator">-</span><span class="token number">06</span><span class="token operator">-</span>26T02<span class="token operator">:</span><span class="token number">55</span><span class="token operator">:</span>22Z <span class="token constant">I</span><span class="token operator">!</span> Loaded outputs<span class="token operator">:</span> influxdb_v2
<span class="token number">2021</span><span class="token operator">-</span><span class="token number">06</span><span class="token operator">-</span>26T02<span class="token operator">:</span><span class="token number">55</span><span class="token operator">:</span>22Z <span class="token constant">I</span><span class="token operator">!</span> Tags enabled<span class="token operator">:</span> host<span class="token operator">=</span>k3s<span class="token operator">-</span>master
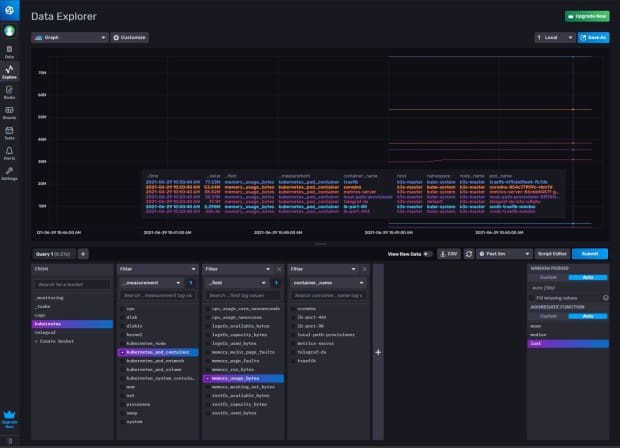
<span class="token number">2021</span><span class="token operator">-</span><span class="token number">06</span><span class="token operator">-</span>26T02<span class="token operator">:</span><span class="token number">55</span><span class="token operator">:</span>22Z <span class="token constant">I</span><span class="token operator">!</span> <span class="token punctuation">[</span>agent<span class="token punctuation">]</span> Config<span class="token operator">:</span> Interval<span class="token operator">:</span>10s<span class="token punctuation">,</span> <span class="token literal-property property">Quiet</span><span class="token operator">:</span><span class="token boolean">false</span><span class="token punctuation">,</span> <span class="token literal-property property">Hostname</span><span class="token operator">:</span><span class="token string">"k3s-master"</span><span class="token punctuation">,</span> Flush Interval<span class="token operator">:</span>10sEverything seems fine, but now comes the moment of truth. We go to our InfluxDB Cloud account, navigate to the Explore section, and we should see some measurements and, of course, some data when selecting the bucket.
As you can see, this process isn’t as complicated as it might seem. The Helm chart simplifies our lives and from now on we can see what is happening with our cluster using an external system.
Guest post originally published on The New Stack by Ignacio Van Droogenbroeck, Senior Sales Engineer at InfluxData
Source CNCF
For enquiries, product placements, sponsorships, and collaborations, connect with us at [email protected]. We'd love to hear from you!
Our humans need coffee too! Your support is highly appreciated, thank you!