aster.cloud aster.cloud
  • /
  • Platforms
    • Public Cloud
    • On-Premise
    • Hybrid Cloud
    • Data
  • Architecture
    • Design
    • Solutions
    • Enterprise
  • Engineering
    • Automation
    • Software Engineering
    • Project Management
    • DevOps
  • Programming
    • Learning
  • Tools
  • About
  • /
  • Platforms
    • Public Cloud
    • On-Premise
    • Hybrid Cloud
    • Data
  • Architecture
    • Design
    • Solutions
    • Enterprise
  • Engineering
    • Automation
    • Software Engineering
    • Project Management
    • DevOps
  • Programming
    • Learning
  • Tools
  • About
aster.cloud aster.cloud
  • /
  • Platforms
    • Public Cloud
    • On-Premise
    • Hybrid Cloud
    • Data
  • Architecture
    • Design
    • Solutions
    • Enterprise
  • Engineering
    • Automation
    • Software Engineering
    • Project Management
    • DevOps
  • Programming
    • Learning
  • Tools
  • About
  • Design
  • Platforms
  • Technology

Introducing gRPC Observability For Microservices

  • aster.cloud
  • November 16, 2022
  • 3 minute read
gRPC is a modern open source high performance Remote Procedure Call (RPC) framework that can run in any environment. It plays a critical role in efficiently connecting microservices in and across data centers with pluggable support for load balancing, tracing, health checking, authentication and other cross-cutting features. It may also be applied in the last mile of distributed computing to connect devices, mobile applications and browsers to backend services hosted on the public cloud. This unique position in the software stack can provide a clear end-to-end view of the whole system. A new gRPC observability feature provides this clarity for workloads running on, and/or able to connect to, Google Cloud.

The kinds of observability data provided

gRPC observability provides three different types of data:


Partner with aster.cloud
for your next big idea.
Let us know here.


From our partners:

CITI.IO :: Business. Institutions. Society. Global Political Economy.
CYBERPOGO.COM :: For the Arts, Sciences, and Technology.
DADAHACKS.COM :: Parenting For The Rest Of Us.
ZEDISTA.COM :: Entertainment. Sports. Culture. Escape.
TAKUMAKU.COM :: For The Hearth And Home.
ASTER.CLOUD :: From The Cloud And Beyond.
LIWAIWAI.COM :: Intelligence, Inside and Outside.
GLOBALCLOUDPLATFORMS.COM :: For The World's Computing Needs.
FIREGULAMAN.COM :: For The Fire In The Belly Of The Coder.
ASTERCASTER.COM :: Supra Astra. Beyond The Stars.
BARTDAY.COM :: Prosperity For Everyone.

1. Logs for key RPC events, including:

  • When the client/server sends or receives the metadata of an RPC
  • When the client/server sends or receives the message payload of an RPC
  • When the client/server finishes an RPC with a final status (OK, or errors)

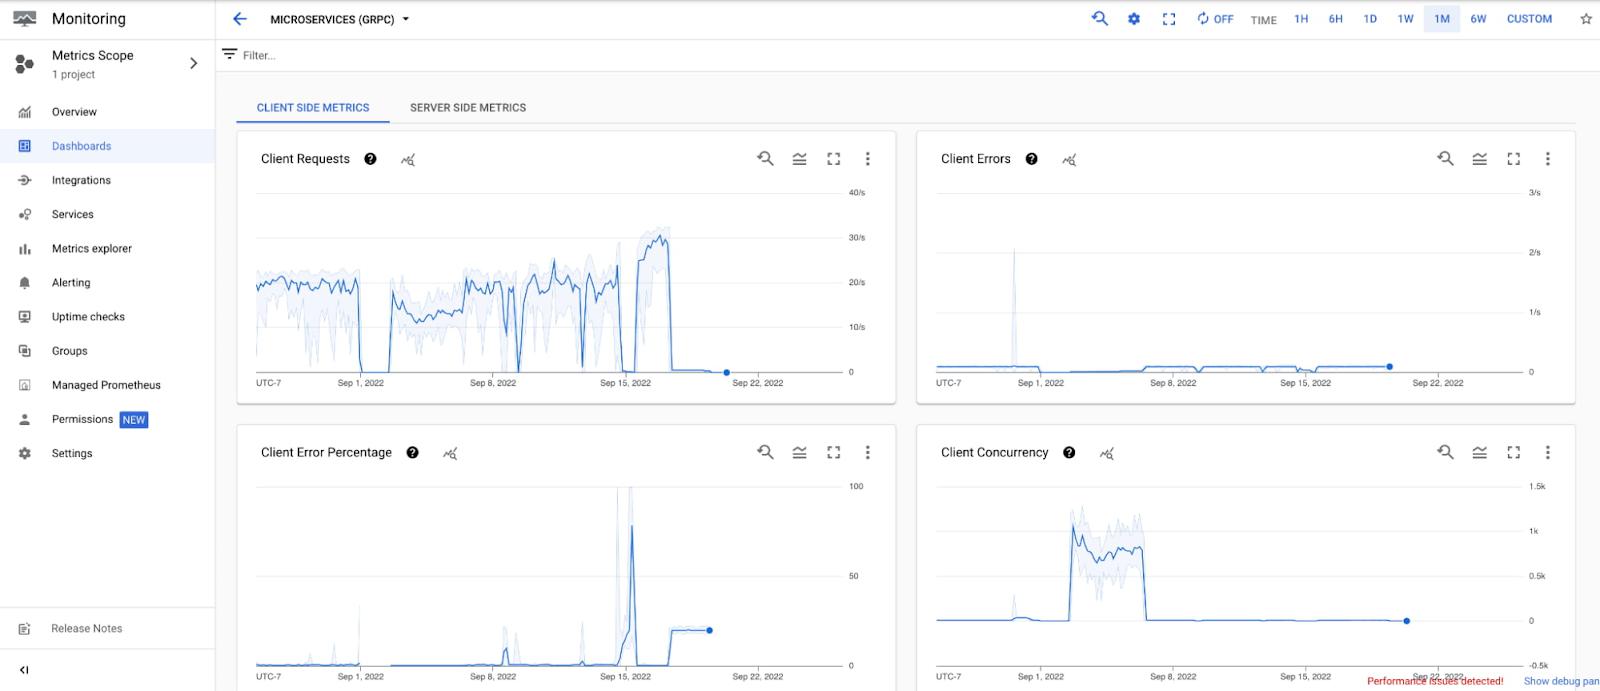
2. Metrics (or statistical data) for key RPC events, including:

  • How many bytes the client/server sent or received
  • How many RPCs the client/server started or completed
  • How long RPCs take to complete between the client and server (known as round trip latency)

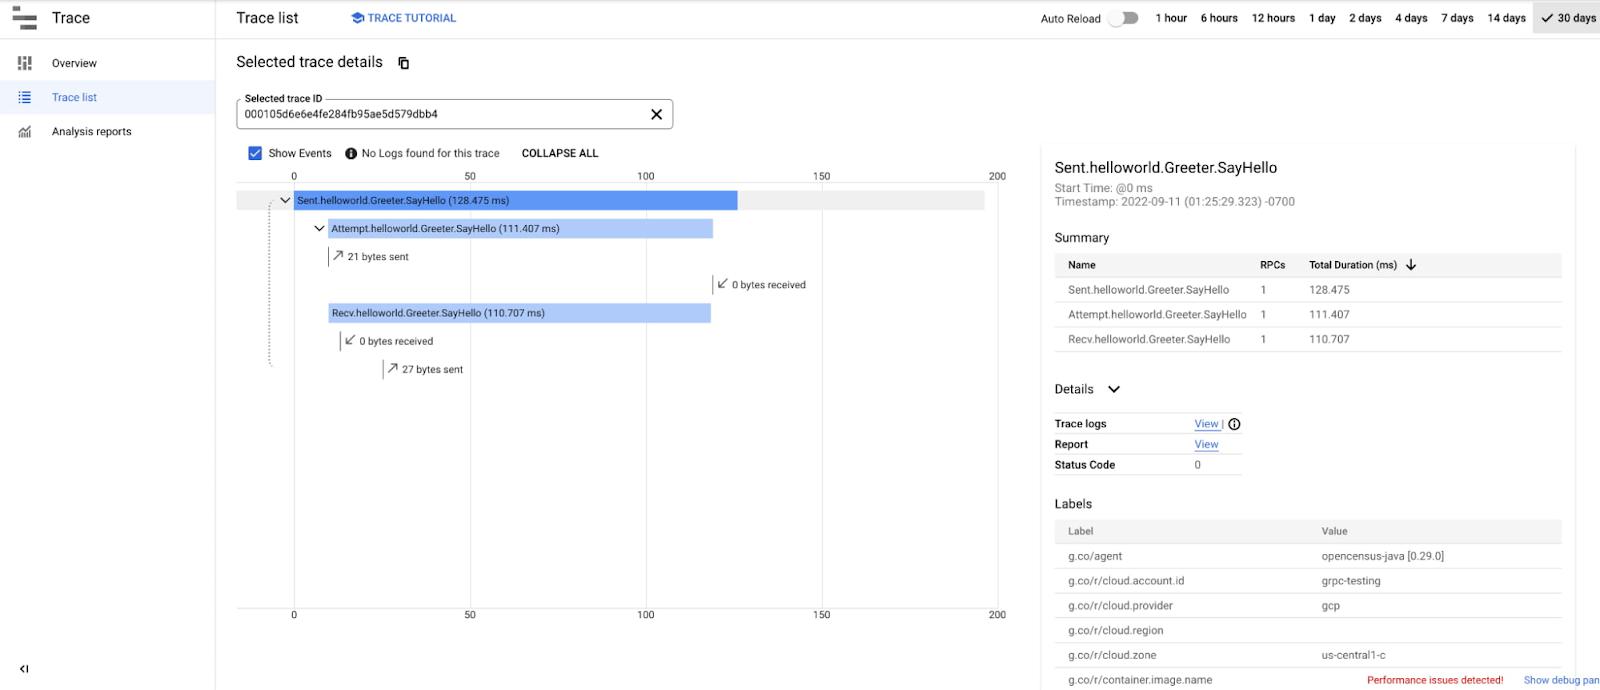
3. Distributed traces for RPCs and their fanout RPCs across the system. For example, when serving an RPC from upstream, a server may need to create multiple RPCs to its own backends. The distributed trace helps the user understand the relationships between these RPCs, the latency for each of them, and key events happening throughout the system.

Read More  What’s New With Cloud Memorystore For Redis

How the observability data is produced and collected

When developers enable the gRPC observability feature in their binaries, the gRPC library will report the logging, metrics, and tracing data to Google Cloud’s operations suite. Once the observability data is collected, users can leverage the Google Cloud console to:

  • Visualize the observability data
  • Export the observability data out of the operations tools for further analysis with other tools.
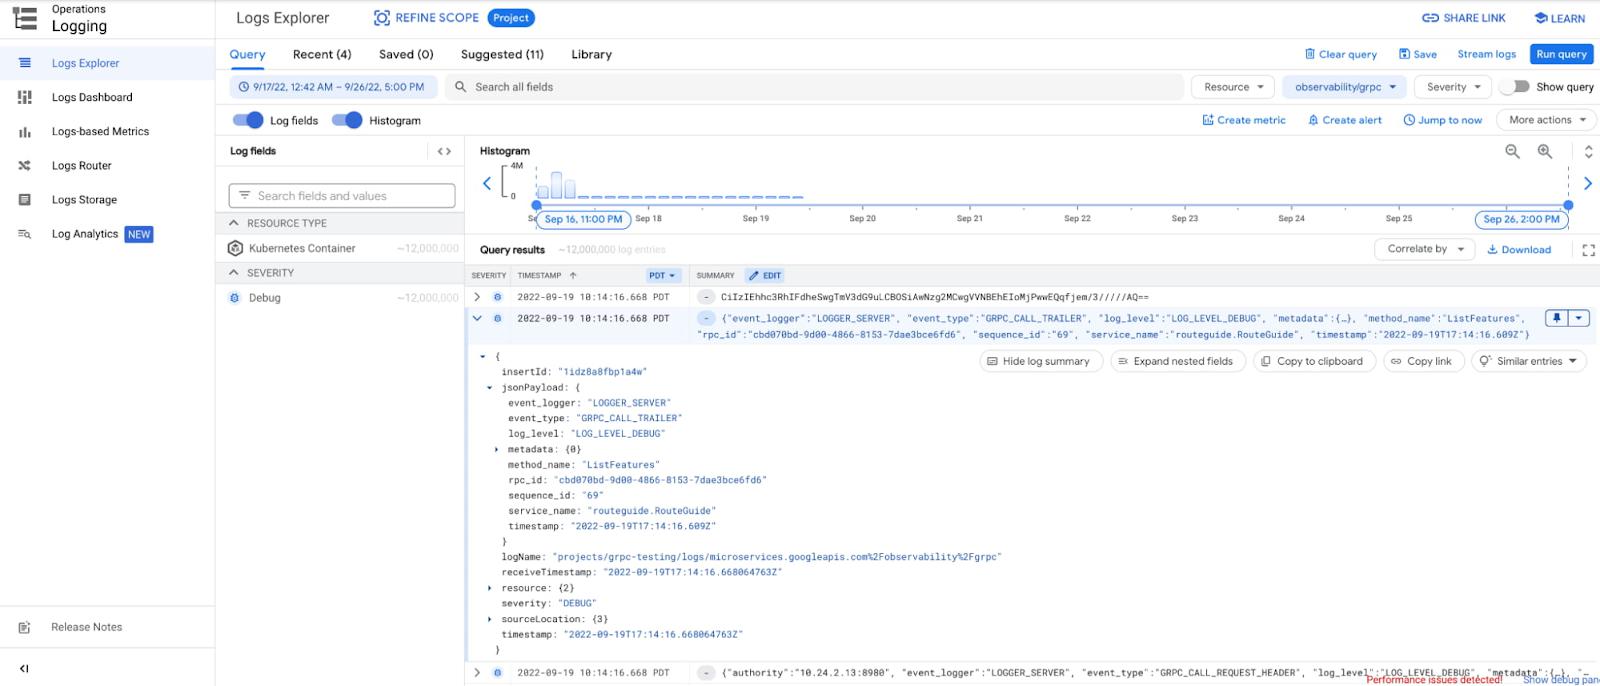
Logging

gRPC observability provides logs for key RPC events with information to help developers understand the context when these events occur. This contextual information can include which gRPC service/method is being invoked, whether the events happen on the client side or server side, whether it’s sending metadata or payloads, the size of the corresponding data, and even the concrete content of the metadata and/or payloads. These log entries are then presented in Cloud Logging with helpers to filter and even customize the query to search related logs.

MetricsgRPC observability provides several metrics: the round trip latency of RPCs, how many RPCs were started and finished during a specific period of time, and even the number of bytes sent/received over the wire. All these metrics can be grouped by a few important parameters, including service/method name and final status. Platform-specific metrics can be included as well, depending on the Google Cloud environment and the gRPC payload actually running. For example, on the Google Kubernetes Engine (GKE) platform, developers can group/filter by namespace, container, and pod information fields to dig into more granular statistical data. With these metrics, Cloud Monitoring enables users to identify problems including:

  • Which container is having higher than normal latency
  • Which pod is having higher than normal error rates
  • And others.
Read More  Using The Local Timezone With Cloud SQL For SQL Server
TracinggRPC observability also allows developers to configure the sampling rate of RPCs. The sampling decision is propagated across the whole system, thus no matter where the RPCs actually happen, developers can always see a complete, end-to-end distributed trace for their processing logic. Sampled RPCs and any further RPCs triggered by them are displayed in Cloud Trace as parent/children spans.

Getting started

With gRPC observability, telemetry data (logs, metrics, traces) of gRPC workloads can be collected and reported to the Google Cloud operations suite. It helps developers get a better understanding of their systems and enables them to diagnose problems such as:

  • Which microservices have suddenly become abnormally slow (long processing latency on the server side)?
  • Which microservices suddenly process less QPS, and is there a pattern?
  • Whether there’s a potential network issue for a particular microservice, as high latency is measured on the client side, but normal latency on the server side? If so, can we locate the problem in a particular cluster, or even a particular node/pod?

To get started with gRPC observability, see our user guide.


By: Feng Li (Software Engineer, Google)
Source: Google Cloud Blog


For enquiries, product placements, sponsorships, and collaborations, connect with us at [email protected]. We'd love to hear from you!

Our humans need coffee too! Your support is highly appreciated, thank you!

aster.cloud

Related Topics
  • Google Cloud
  • gRPC
  • Logging
  • Metrics
  • Networking
  • Remote Procedure Call
You May Also Like
View Post
  • Technology

Building secure, scalable AI in the cloud with Microsoft Azure

  • July 5, 2025
View Post
  • Computing
  • Multi-Cloud
  • Technology

Turns out OpenAI is the customer behind Oracle’s mysterious $30 billion cloud deal

  • July 3, 2025
View Post
  • Computing
  • Multi-Cloud
  • Technology

A looming hyperscaler exodus? UK IT leaders are thinking of ditching US cloud providers – here’s why

  • June 26, 2025
View Post
  • Computing
  • Multi-Cloud
  • Technology

Prioritize security from the edge to the cloud

  • June 25, 2025
View Post
  • Computing
  • Multi-Cloud
  • Technology

6 edge monitoring best practices in the cloud

  • June 25, 2025
Genome
View Post
  • Technology

AlphaGenome: AI for better understanding the genome

  • June 25, 2025
View Post
  • Computing
  • Multi-Cloud
  • Technology

Pure Accelerate 2025: All the news and updates live from Las Vegas

  • June 18, 2025
View Post
  • Computing
  • Multi-Cloud
  • Technology

‘This was a very purposeful strategy’: Pure Storage unveils Enterprise Data Cloud in bid to unify data storage, management

  • June 18, 2025

Stay Connected!
LATEST
  • 1
    Building secure, scalable AI in the cloud with Microsoft Azure
    • July 5, 2025
  • 2
    Turns out OpenAI is the customer behind Oracle’s mysterious $30 billion cloud deal
    • July 3, 2025
  • aster-cloud-erp-bill_of_materials_2 3
    What is an SBOM (software bill of materials)?
    • July 2, 2025
  • aster-cloud-sms-pexels-tim-samuel-6697306 4
    Send SMS texts with Amazon’s SNS simple notification service
    • July 1, 2025
  • Camping 5
    The Summer Adventures : Camping Essentials
    • June 27, 2025
  • aster-cloud-website-pexels-goumbik-574069 6
    Host a static website on AWS with Amazon S3 and Route 53
    • June 27, 2025
  • 7
    A looming hyperscaler exodus? UK IT leaders are thinking of ditching US cloud providers – here’s why
    • June 26, 2025
  • Prioritize security from the edge to the cloud
    • June 25, 2025
  • 6 edge monitoring best practices in the cloud
    • June 25, 2025
  • Genome 10
    AlphaGenome: AI for better understanding the genome
    • June 25, 2025
about
Hello World!

We are aster.cloud. We’re created by programmers for programmers.

Our site aims to provide guides, programming tips, reviews, and interesting materials for tech people and those who want to learn in general.

We would like to hear from you.

If you have any feedback, enquiries, or sponsorship request, kindly reach out to us at:

[email protected]
Most Popular
  • 1
    There’s a ‘cloud reset’ underway, and VMware Cloud Foundation 9.0 is a chance for Broadcom to pounce on it
    • June 17, 2025
  • 2
    ‘This was a very purposeful strategy’: Pure Storage unveils Enterprise Data Cloud in bid to unify data storage, management
    • June 18, 2025
  • 3
    Pure Accelerate 2025: All the news and updates live from Las Vegas
    • June 18, 2025
  • Oracle adds xAI Grok models to OCI
    • June 17, 2025
  • What is cloud bursting?
    • June 18, 2025
  • /
  • Technology
  • Tools
  • About
  • Contact Us

Input your search keywords and press Enter.