Google Cloud Storage is a managed service for storing unstructured data and allowing retrieval of the data as often as users like. Because Cloud Storage is a fundamental and highly utilized service, the observability of storage is critical for storage engineers’ and administrators’ day-to-day operations. It is also critical for the scalability and sustainability of a business.
From our partners:
- What’s the best practice to get me started with observing my storage projects and buckets?
- What’s the most important operational metrics/logs I should be monitoring to proactively identify issues and troubleshoot?
- What if I want to create alerts for the storage metrics I care about? How can I do that? Can I see my alerts inside the storage project or for the buckets?
Users also comment that they have to hop between different observability tools, which causes them to frequently lose context when navigating between multiple monitoring platforms.
Today, we are excited to announce the public preview of a new set of Cloud Storage Monitoring Dashboards for Cloud Storage, which are available at both the project level and bucket level.
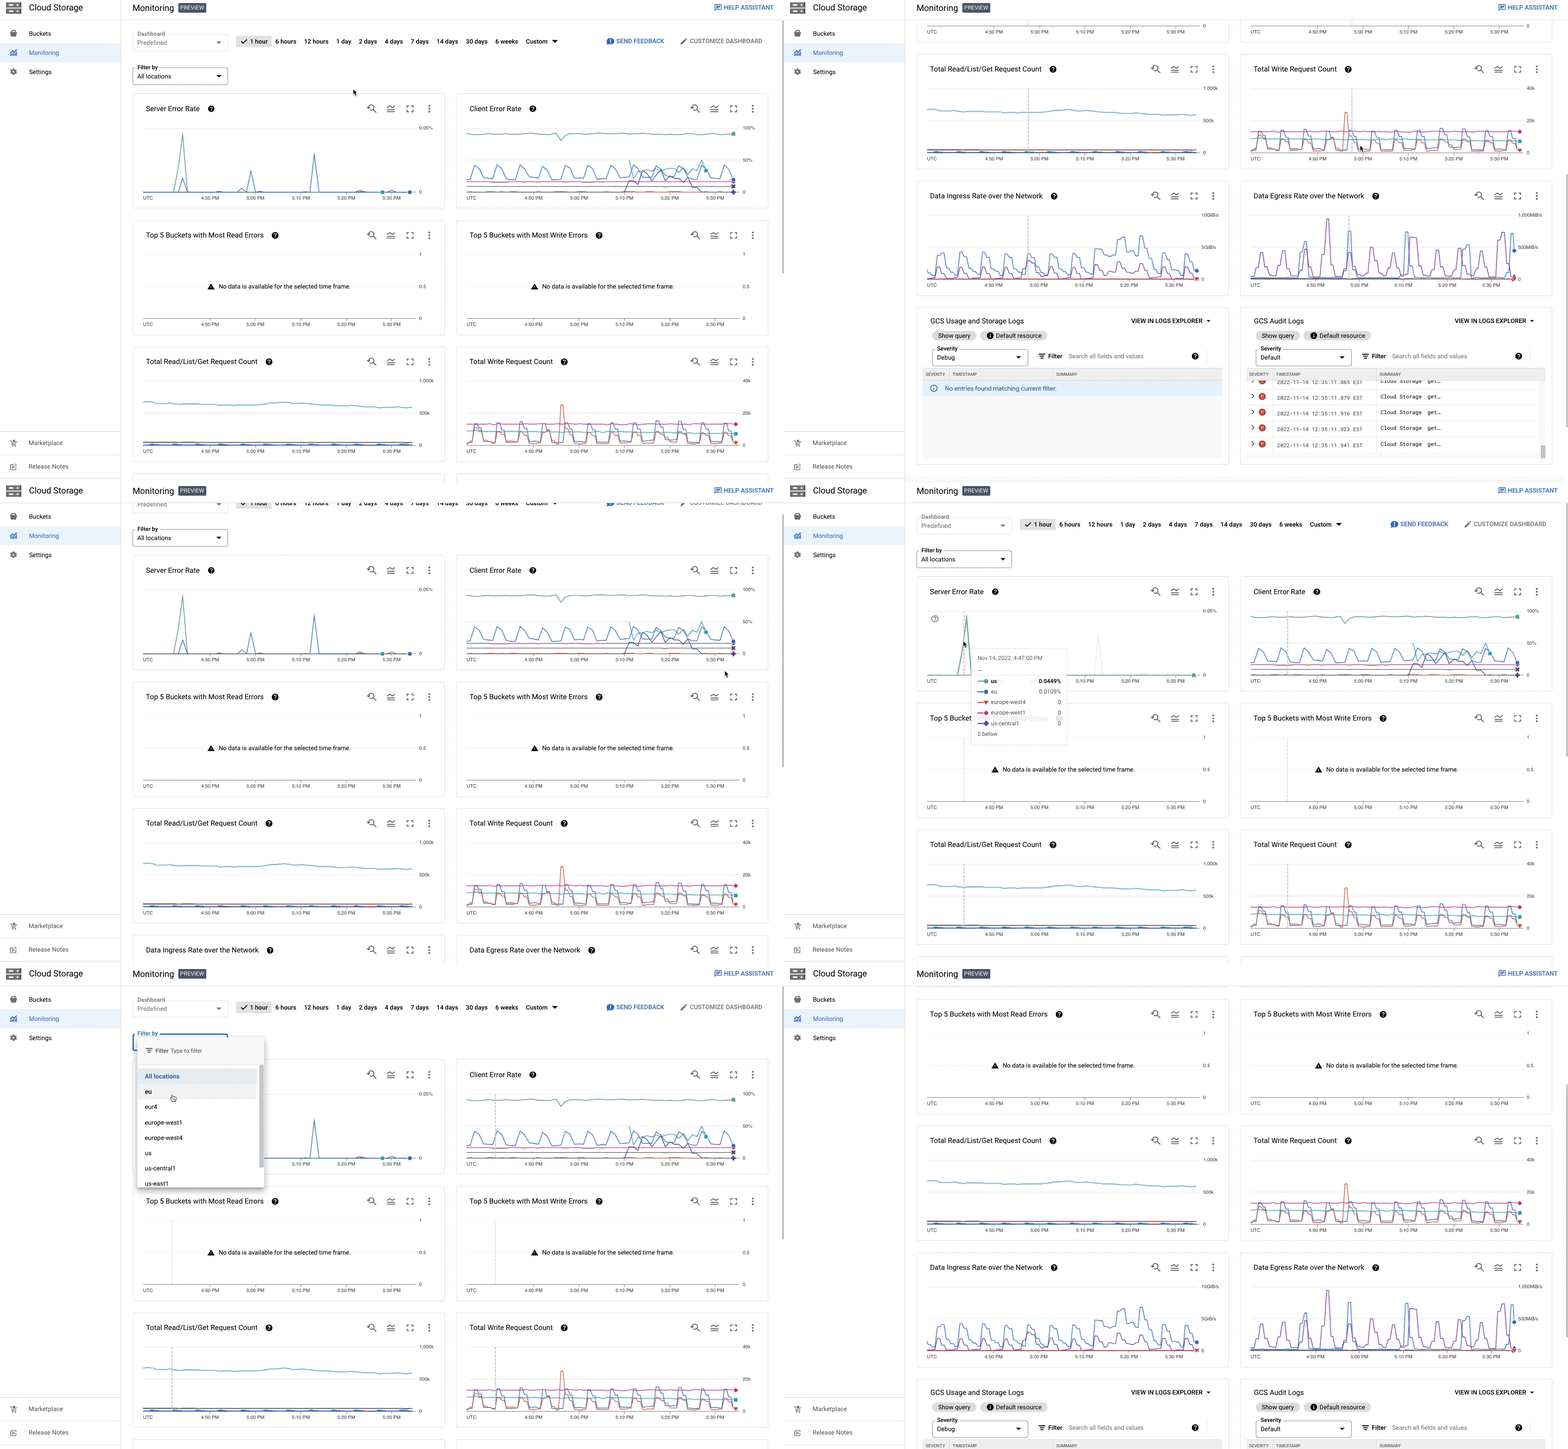
All Cloud Storage users can now access the new dashboards through the Monitoring tab on the left navigation menu.

Highly customizable for your needs
We know that there is no one-size-fits-all observability that could satisfy all users’ needs. So we made these dashboards customizable in-context, allowing you to create your own dashboard version and set it as the default view. If you have monitoring editor or owner access or project editor or owner access, you can add an alert chart from a previously created alert policy, or you can create an alert by customizing the out-of-the-box dashboard. You are able to see the alerts directly in-context on the Cloud Storage Monitoring page if you added the alert chart in a customized dashboard. You can also add metrics from different services on the dashboards to observe correlations without leaving the storage pages of the Google Cloud console.
In the logs panel, you can edit the log viewer query to reflect the most important logs you care about and persist that query in the storage project customized dashboard. Ability to browse metrics and logs on the same dashboard reduces context switching and enables more effective troubleshooting.
The customizable dashboard enables you to perform the troubleshooting journey inside the storage pages on the platform, reducing the need to navigate between different monitoring tools, or even different monitoring platforms.
Operational metrics out-of-the-box
There are many aspects of storage observability, and the new monitoring dashboards are focused on troubleshooting. These include out-of-the-box storage system metrics and storage system logs that every storage user automatically receives when initiating the storage service on Google Cloud.
You can hover over the chart and read the values or expand the legend, zoom in or zoom out the time range to see more granular or coarse data, and use advanced queries such as MQL or PromQL in the Cloud Monitoring UI. In fact, you have the ability to use the full functionality of Cloud Monitoring dashboarding inside storage pages on the Google Cloud console.
Here are some more details on the charts and the log panels available on these dashboards.
Charts
Server Error Rate of Storage API Request Count: filtered to display all server side 5xx errors
Client Error Rate of Storage API Request Count: filtered to display all client side 4xx errors including their response codes
Top 5 Buckets with Most Read Errors: filtered to List and Read methods, and the response code is filtered to the INTERNAL and UNAVAILABLE errors, as measured from the top 5 buckets. You can easily customize the chart to display more buckets with these errors.
Top 5 Buckets with Most Write Errors: similar to the most read errors, this chart is filtered to the WriteObject method when the response code is INTERNAL and UNAVAILABLE errors.
Total Read/List/Get Request Count: filtered by the API request count with the Read, List and Get methods. You should expect to see the total number of requests for these three methods in a given time and see the total counts broken down by the location of the API method.
Total Write Request Count: filtered by the Write method from all the API requests and shows you the total number of write requests, also broken down by the location.
Data Ingress Rate over the Network: shows the rate of received bytes so you can easily understand the rate of ingress per project or per bucket.
- This chart can be customized to show total volume of received bytes for project
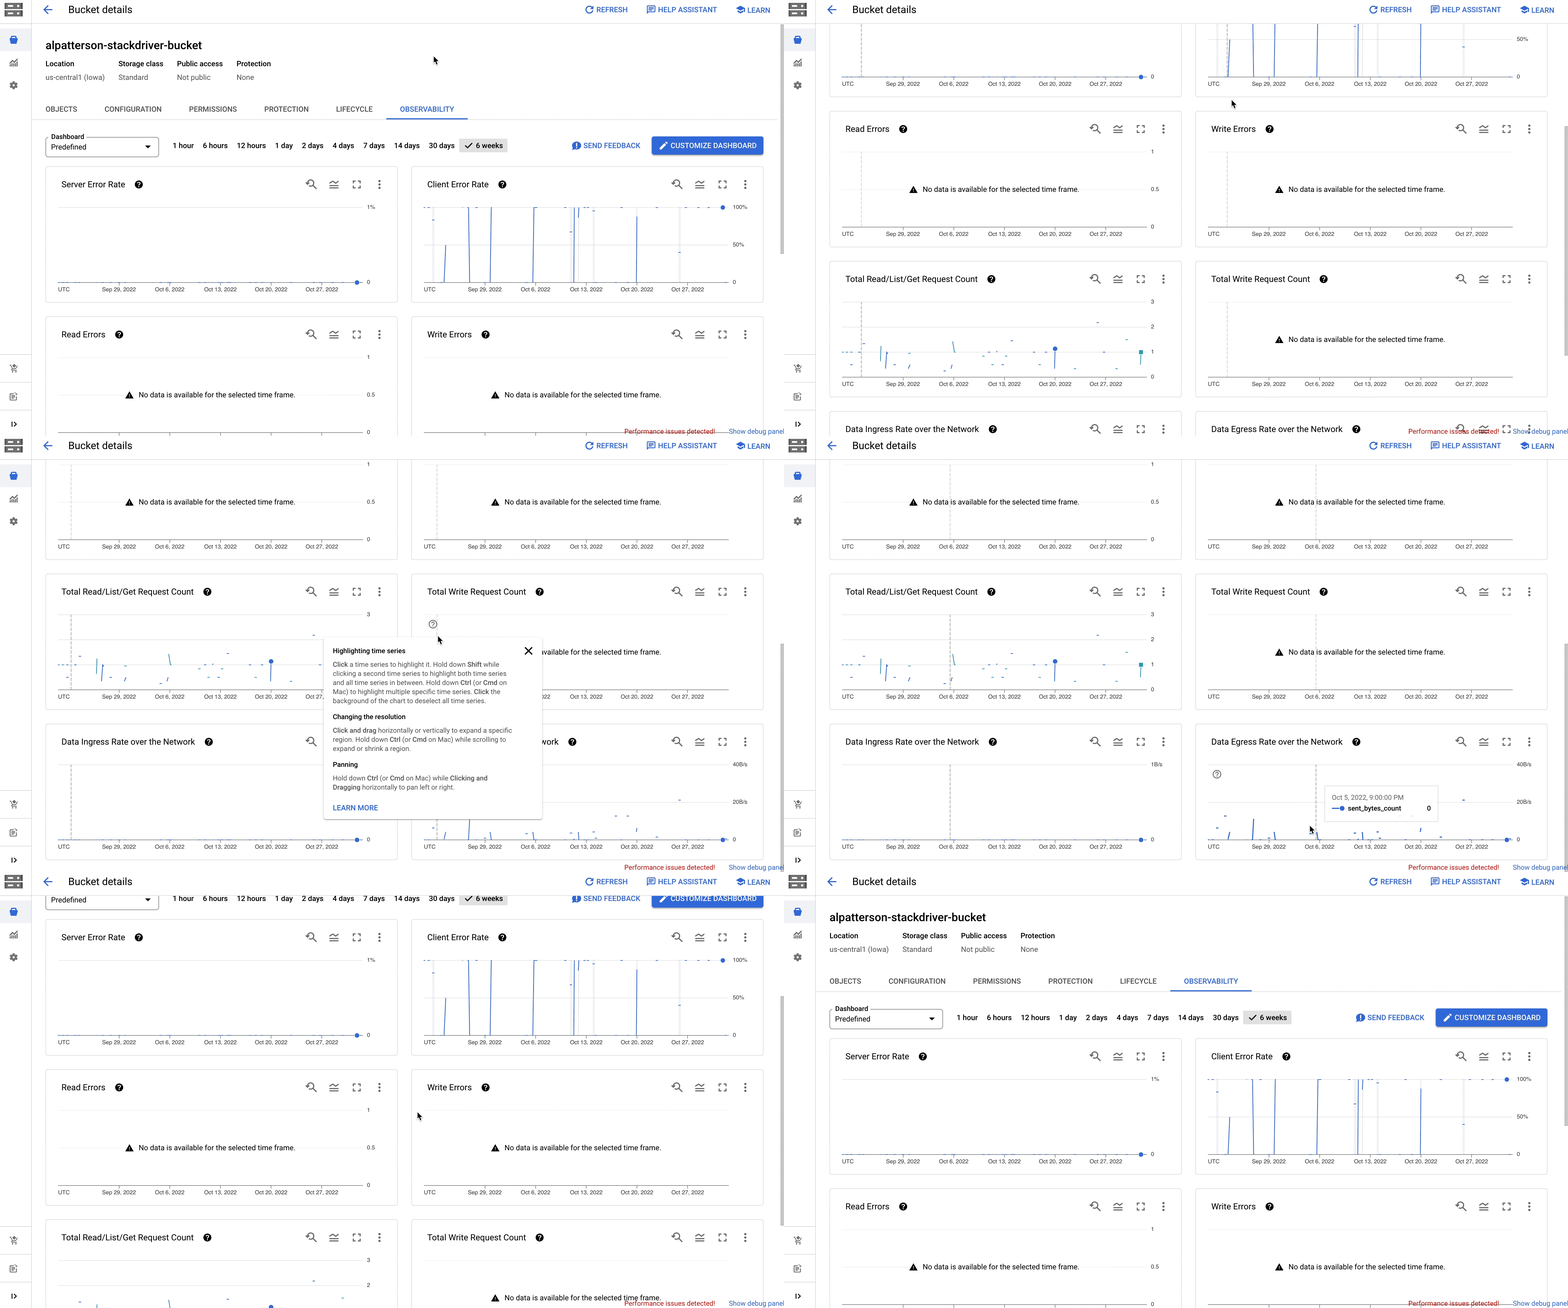
- At the bucket-level dashboard, this chart is filtered to show the per bucket ingress rate in the project
Data Egress Rate over the Network: shows the rate of sent bytes so you can easily understand the rate of egress per project or per bucket.
Log Panels
GCS Logs and Audit logs Widgets
- The two logs widgets are filtered to GCS logs and GCS Audit logs with a severity equal to or greater than Error. Logs with severity of Error, Critical, Alert, and Emergency will be displayed in the logs panel.
- You can expand on the logs entry in the widget and can easily navigate to the logs explorer view by clicking on View in logs Explorer Button.
At the bucket level, we also provide all the charts that are available on the project level, and we filter these dashboards to the specific bucket. Once the customization of a bucket level dashboard is created, the customized bucket level dashboard will automatically be visible to all the bucket level dashboards within the project. You can simply navigate to a different bucket and select from the drop down menu to view the customized dashboard.

Get started today with the preview
You can get started with the preview today by clicking the Monitoring tab on the left navigation menu of the Cloud Storage UI. It is available to all Cloud Storage users.
We are very excited to see these dashboards become publicly available to all of our users and we look forward to hearing from you for suggestions and feedback.
On each of the dashboards, you can submit the feedback using the “Send Feedback” button. We will carefully read each of your suggestions and will make continuous improvements to the dashboard to help all users analyze their daily operations within Cloud Storage.
By: Joy Wang (Product Manager) and Subodh Bhargava (Product Manager)
Source: Google Cloud Blog
For enquiries, product placements, sponsorships, and collaborations, connect with us at [email protected]. We'd love to hear from you!
Our humans need coffee too! Your support is highly appreciated, thank you!


