Prometheus has become the de facto standard for time series metrics for both Cloud Native and legacy environments. Many technologies in the CNCF Landscape already include a Prometheus metrics endpoint and there are metric exporters for numerous other technologies. Running Prometheus on Kubernetes is straightforward with Helm charts for the Operator or the community Kube Stack. For bare metal, most Linux distributions include Prometheus in their software repositories. Finally, Prometheus as a service is available on AWS, Azure, GCP, and others such as Grafana, Victoria Metrics, Logz, and OpsVerse.
With the minimal effort of a day, a Prometheus server can be up, running, and collecting data. However, as many soon find out this is but the first step of a very long and never-ending journey.
From our partners:
Value Out
Great, you’ve completed the first step and you have a Prometheus instance full of data and you’re feeling pretty pleased with yourself. Now you just need to get some actionable information out, Grafana is the dashboard tool of choice to pair with Prometheus. Creating a useful set of dashboards is a nontrivial and time-consuming task. First of all, you’ll have to learn PromQL, the Prometheus query language, and you’ll have to learn which are the important metrics for each of the technologies you’re observing.
After some considerable toil, you now have a rudimentary set of dashboards covering the essentials. It soon gets tedious constantly watching dashboards, it would be much better to receive an alert notification if anything goes out of bounds. Now you are required to learn the fine art of threshold balancing. Setting too low will flood you with many false positives, setting too high will not trigger until it’s too late. Even if you manage to get the balance just right, you still just receive a series of discreet alerts without any context or correlation. This makes it impossible to know which are important and which are the initial cause or which are the secondary symptoms. This incessant chatter soon leads to alert fatigue.
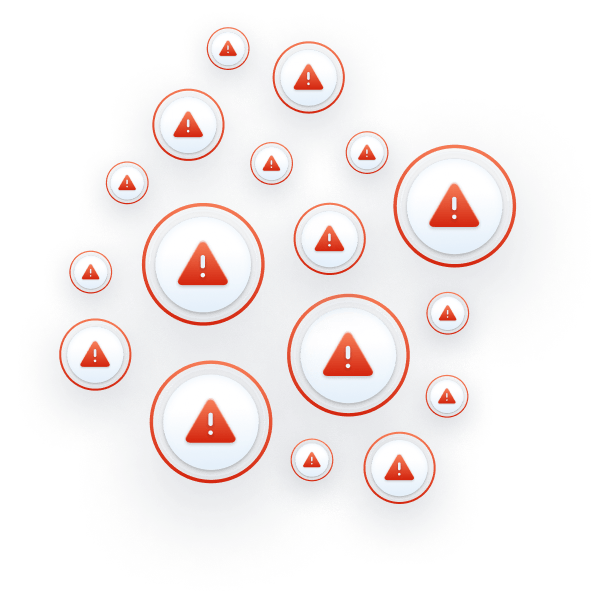
This is why most Prometheus implementations stall after the initial rollout. The failure to get real value out of all the collected data dampens the enthusiasm for implementing any more data collection.
If only there was an easy way to get value out of all that Prometheus data.
Second Step To Value
Asserts intelligently uses your existing Prometheus data to eliminate alert fatigue. Instead of a stream of unrelated alerts, Asserts provides contextual notifications with a direct link to the Root Cause Analysis Workbench, which automatically groups associated signals in one place, all the information you need is just a click away.
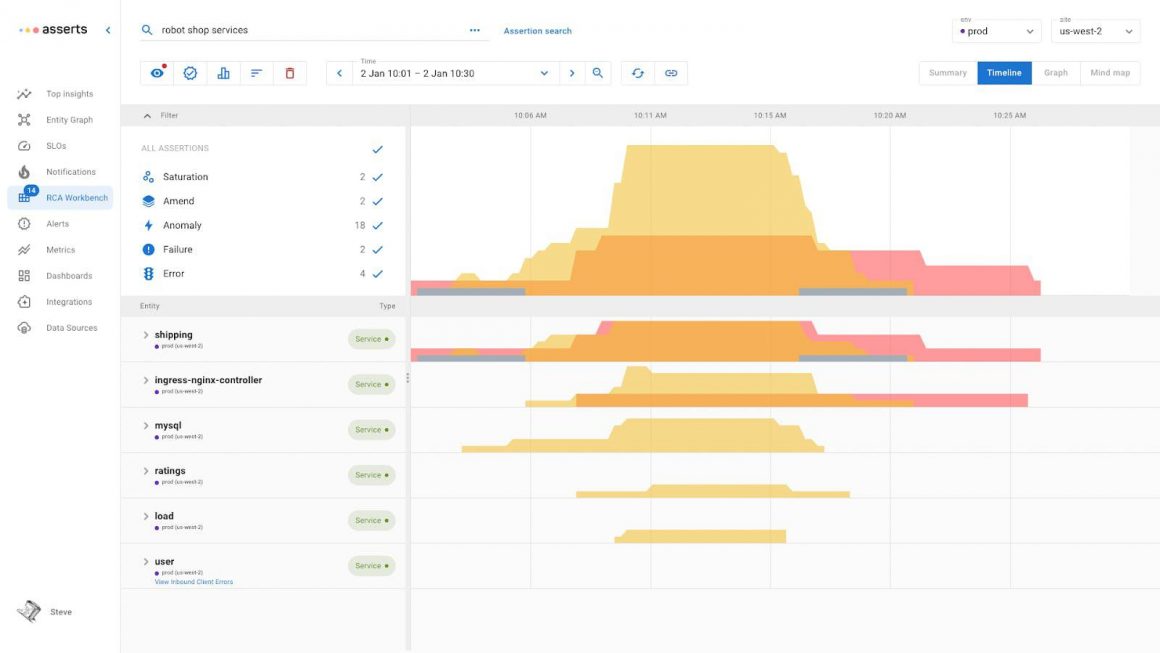
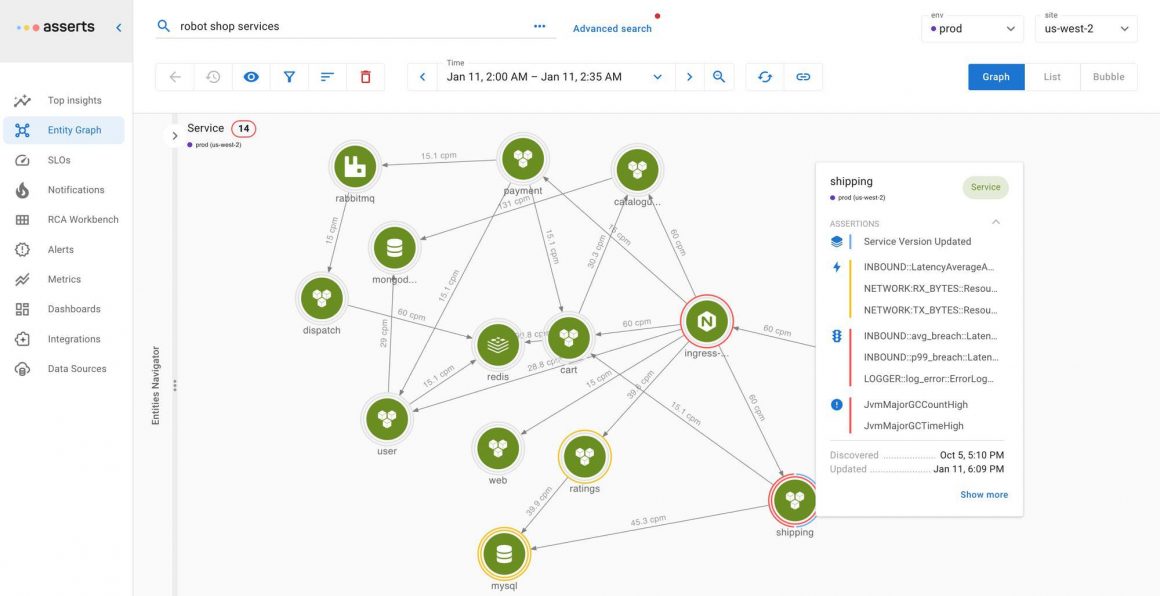
Asserts continually analyses the metric labels on your Prometheus data to build the Entity Graph tracking relationships over time. This enables Asserts to intelligently group alerts together, thus providing all the information you need for root cause analysis just a click away.
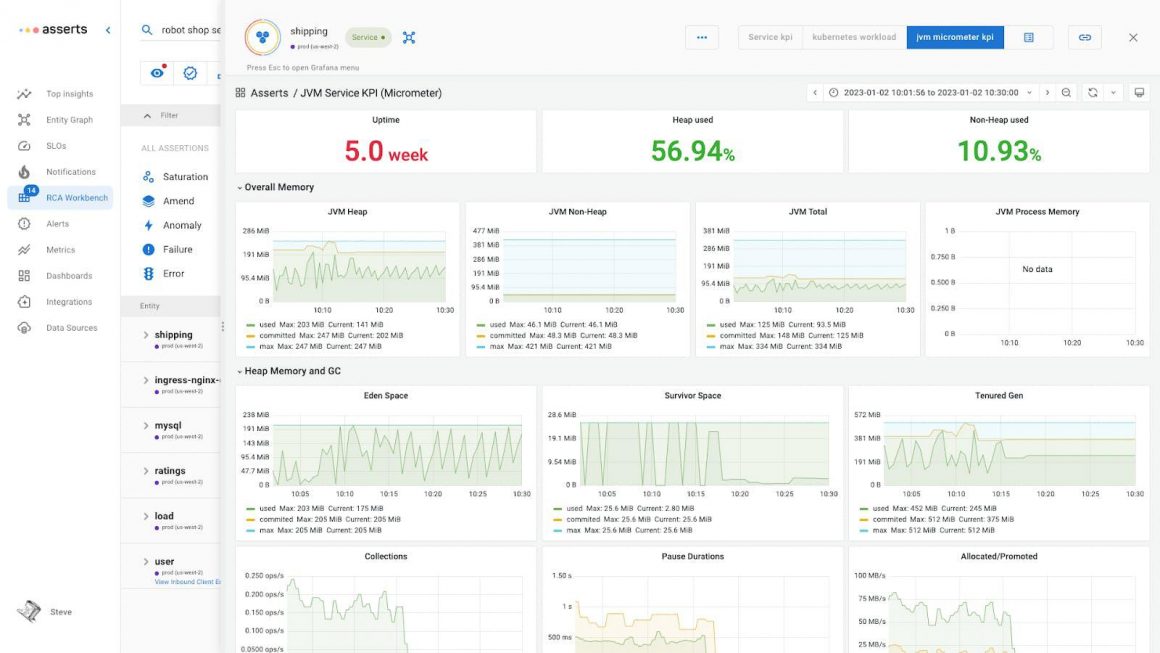
Asserts includes curated libraries for alert rules and Grafana dashboards, freeing you from the toil of creating and maintaining these resources; not to mention learning PromQL. If you already have some favorite dashboards, you can import them into Asserts and continue to use them. The alert rule library can also be easily edited to fine-tune to your exact requirements.
Asserts integrates with your existing log aggregation and tracing tools providing deep linking with context. Go straight from Asserts to log or trace analytics with the query and time range prepopulated. All the information you need is just a click away.
Path To SRE Nirvana
With the extra layer of automation and intelligence that Asserts provides on top of your existing Prometheus data, you’ll soon be getting real value from an asset you already have. However, this is only just the beginning of value realization. Now that you can effortlessly manage all your Prometheus data and eliminate alert fatigue, there’s no reason not to add more metric data. Many technologies provide a Prometheus metrics endpoint or there are numerous exporters available. These can be simply added without any code changes, significantly increasing the Observability coverage of your applications.
To achieve SRE Nirvana with complete visibility into your applications and the maximum value from your Prometheus investment, the Prometheus agent is added to the application code. This will provide deep metrics for the service runtime (Java, Go, Python, NodeJS, …) along with RED (Rate, Errors, Duration) metrics for each endpoint. With full metric coverage, application environments can be managed by setting Service Level Objectives (SLO) against application functionality. You will now have a smug sense of satisfaction that you have achieved Nirvana and have a reference implementation of the SRE Handbook.
Maximize the value of your Prometheus environment with a free trial of Asserts today.
Also published here.
By: Asserts
Source: Hackernoon
For enquiries, product placements, sponsorships, and collaborations, connect with us at [email protected]. We'd love to hear from you!
Our humans need coffee too! Your support is highly appreciated, thank you!

