aster.cloud aster.cloud
  • /
  • Platforms
    • Public Cloud
    • On-Premise
    • Hybrid Cloud
    • Data
  • Architecture
    • Design
    • Solutions
    • Enterprise
  • Engineering
    • Automation
    • Software Engineering
    • Project Management
    • DevOps
  • Programming
  • Tools
  • About
  • DevOps
  • Platforms
  • Programming

Extended Retention For Custom And Prometheus Metrics In Cloud Monitoring

  • relay
  • August 31, 2020
  • 3 minute read

Metrics help you understand how your business and applications are performing. Longer metric retention enables quarter-over-quarter or year-over-year analysis and reporting, forecasting seasonal trends, retention for compliance, and much more. We recently announced the general availability (GA) of extended metric retention for custom and Prometheus metrics in Cloud Monitoring, increasing retention from 6 weeks to 24 months. Extended retention for custom and Prometheus metrics is enabled by default.

Longer retention is particularly useful in financial services, retail, healthcare, and media organizations. For example, a finance team could use the extended data to forecast seasonal trends, so that you know how many Compute Engine instances to reserve ahead of time for Black Friday. Similarly, a DevOps team could use year over year data to help inform a scaling plan for Cyber Monday.

To achieve higher charting performance, Cloud Monitoring stores metric data for 6 weeks at its original sampling frequency, then downsamples it to 10-minute intervals for extended storage. This ensures that you can view extended retention metrics but still query with high performance. There is no additional cost for extended retention (see Cloud Monitoring chargeable services which is based on volume ingestion for specific metric types).

Extended retention for Google Cloud (system) metrics, agent metrics, and other metric types is coming soon.

How to query extended retention metrics

Let’s take an example scenario where you have a Compute Engine VM running a web application. In that web app, you write a metric that tracks a critical user journey for which you want to perform a month-over-month analysis.

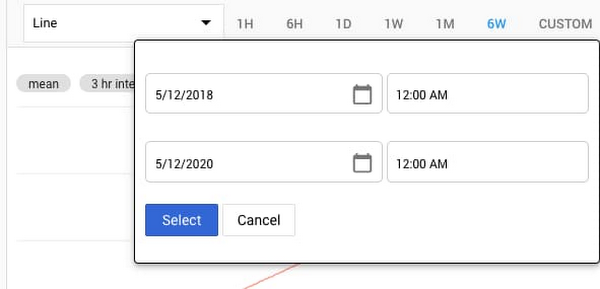
To query metric data for a month-over-month comparison, go to Cloud Monitoring and select Metrics Explorer. Select your custom or Prometheus metric and the resource type. Then click on “Custom” in the time range selector above the chart. Previously the time-range selector only allowed you to select up to 6 weeks of metric data; now you can select up to 24 months.

Read More  How To Kill Your Developer Productivity
1 Querying extended retention metric data.jpg
Querying extended retention metric data for custom and Prometheus metrics in Cloud Monitoring Metrics Explorer
2 Custom time range selector.jpg
The Custom time range selector lets you query metric data that is up to 24 months old

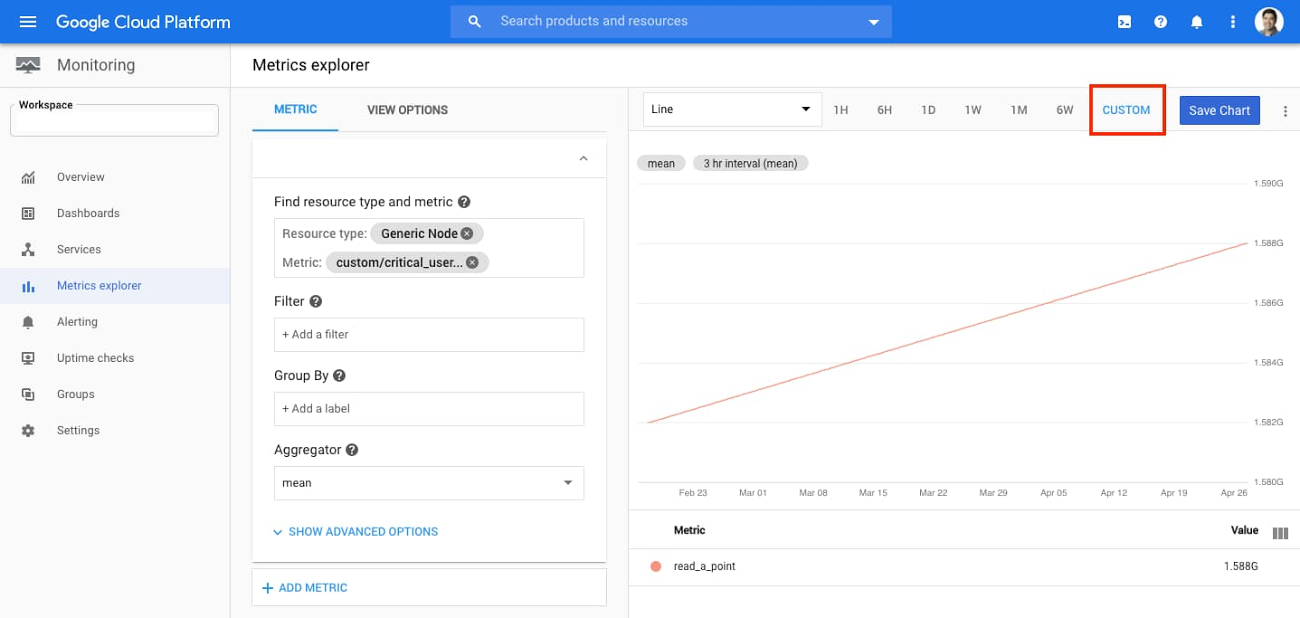
In addition to the UI, you can also perform the above query steps programmatically through the ListTimeSeries endpoint of the Monitoring API.

The above query lets you view metric data values for a given time range. But how do you compare results month over month?

To perform time shift analysis, you can use the Cloud Monitoring Query Language, which recently became generally available.

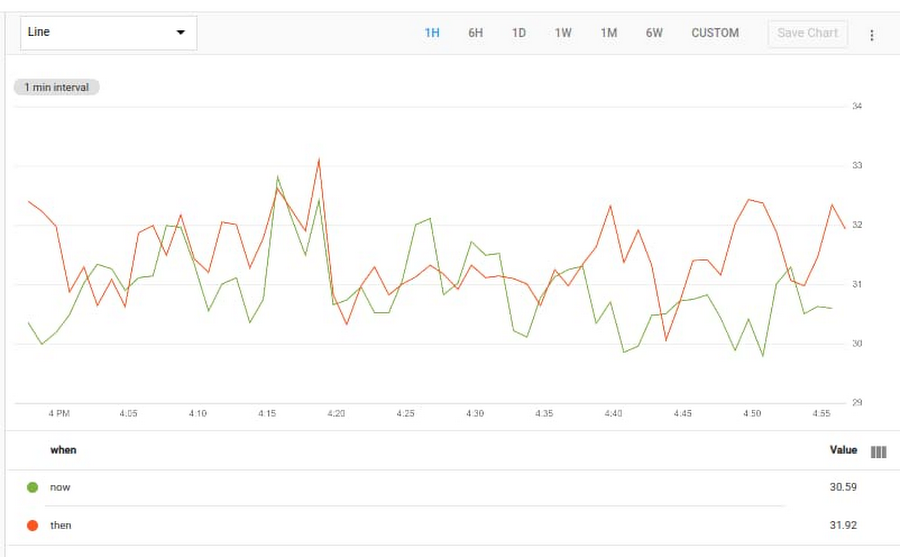
Let’s take the example of a custom metric that tracks request counts for a shopping cart service in an e-commerce application. The following query returns the overall mean request counts now and from a month ago. Using “union”, you can display these two results on the same chart.

Note: the resource and metric specified below are an example; to use it in your environment, replace them with your own custom or Prometheus metric.

fetch generic_task::custom.googleapis.com/shopping_cart_service/request_count
| group_by []
| {
     add [when: "now"]
  ;
     add [when: "then"] | time_shift 30d
  }
| union

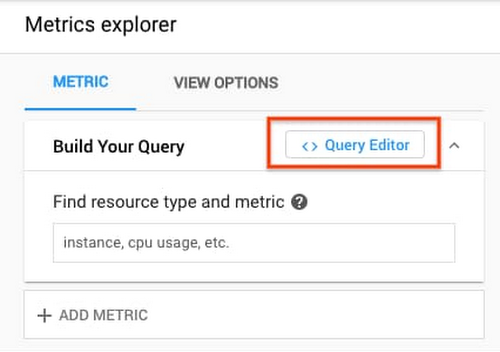
To enter the query, go to Metrics Explorer and click the “Query Editor” button:

3 Query Editor.jpg

Enter the above query, click “Run Query”, and you’ll see a result like the following:

4 Run Query.jpg

Extending the usefulness of metrics

With Cloud Monitoring, we give you visibility into your data and help you to understand the health and performance of your services and applications. Extended metric retention helps your DevOps, engineering, and business teams with troubleshooting and debugging, compliance, reporting, and many other use cases. It allows you to do real-time operations and long-term data analysis in a single tool, without needing to export to another data analytics tool.

If you have any questions or feedback, please click Help > Send Feedback in the Cloud Monitoring UI or contact Cloud Support. We also invite you to join the discussion on our mailing list. As always, we welcome your feedback.

Read More  Announcing Glance: Tiles For Wear OS Made simple
Rory Petty
Cloud Monitoring Product Manager
Shishi Chen
Cloud Monitoring Software Engineer
relay

Related Topics
  • Cloud Monitoring
  • Google Cloud
  • Prometheus
  • Query Language
You May Also Like
View Post
  • Automation
  • Programming

Learn Expect By Writing And Automating A Simple Game

  • March 14, 2023
View Post
  • People
  • Platforms
  • Technology

Women’s History Month: Celebrating The Success Of Women Founders: Schoolio

  • March 14, 2023
View Post
  • Platforms
  • Technology

Cloudflare Integrates With Atlassian, Microsoft, And Sumo Logic To Make Zero Trust Security Easy For Businesses

  • March 14, 2023
View Post
  • Platforms

Oxford Quantum Circuits Installing Quantum Computer in Equinix IBX® Data Center With Plans To Open Access to Businesses Globally

  • March 14, 2023
View Post
  • Platforms
  • Research
  • Solutions

Salk Institute Leverages Google Cloud For Brain Research—And Launches Their Transformation To The Cloud

  • March 6, 2023
View Post
  • Platforms
  • Technology

CrowdStrike And Dell Technologies Join Forces To Transform Commercial PC Cybersecurity

  • March 6, 2023
View Post
  • Platforms
  • Tools

3 Microsoft Azure AI Product Features That Accelerate Language Learning

  • March 3, 2023
View Post
  • Platforms
  • Solutions
  • Technology

Equinix To Back Five New Solar Farms In Spain

  • February 28, 2023

Stay Connected!
LATEST
  • 1
    Pythonic Techniques For Handling Sequences
    • March 21, 2023
  • 2
    Monitor Kubernetes Cloud Costs With Open Source Tools
    • March 20, 2023
  • 3
    What Is An Edge-Native Application?
    • March 20, 2023
  • 4
    Eclipse Java Downloads Skyrocket
    • March 19, 2023
  • 5
    How To Use Bash
    • March 17, 2023
  • 6
    Why Is Your Multicloud So Slow?
    • March 17, 2023
  • 7
    The Benefits And Core Processes Of Data Wrangling
    • March 17, 2023
  • 8
    We Cannot Even Agree On Dates…
    • March 16, 2023
  • 9
    Financial Crisis: It’s A Game & We’re All Being Played
    • March 16, 2023
  • 10
    Ballerina: A Programming Language For The Cloud
    • March 16, 2023
about
Hello World!

We are aster.cloud. We’re created by programmers for programmers.

Our site aims to provide guides, programming tips, reviews, and interesting materials for tech people and those who want to learn in general.

We would like to hear from you.

If you have any feedback, enquiries, or sponsorship request, kindly reach out to us at:

[email protected]
Most Popular
  • 1
    Lockheed Martin Launches Commercial Ground Control Software For Satellite Constellations
    • March 14, 2023
  • 2
    Oxford Quantum Circuits Installing Quantum Computer in Equinix IBX® Data Center With Plans To Open Access to Businesses Globally
    • March 14, 2023
  • 3
    The Adoptium Working Group Reports Significant Momentum for Open Source Java in 2023
    • March 14, 2023
  • 4
    Cloudflare Integrates With Atlassian, Microsoft, And Sumo Logic To Make Zero Trust Security Easy For Businesses
    • March 14, 2023
  • 5
    Cloudflare Uses The Power Of Its Global Network To Identify The Top 50 Most Impersonated Brands And Protect Zero Trust Customers From Phishing Scams
    • March 13, 2023
  • /
  • Platforms
  • Architecture
  • Engineering
  • Programming
  • Tools
  • About

Input your search keywords and press Enter.