Developing scalable and reliable applications is a serious business. It requires precision, accuracy, effective teamwork, and convenient tooling. During the software construction phase, developers employ numerous techniques to debug and resolve issues within their programs. One of these techniques is to leverage monitoring and logging libraries to discover how the application behaves in edge cases or under load.
Centralized logging gives users access to the information that they need to effectively debug during the development process and LogDNA makes it easy to retain subsets of logs to meet different teams needs. For instance, developers often need access to a true depth of information from their logs, while SREs may be more interested in lightweight logging levels like info and trace. Read on to learn how the LogDNA platform empowers users at all levels of the development process.
From our partners:

Initial Development Environment Setup
The first thing you need to do is sign up with LogDNA. The process is very smooth. From here, you can explore their dashboard.
On the dashboard page, you have the option to pre-load sample log data or configure an agent collector yourself (or you can do both). If you select the sample data, you can add applications later. Here is what the screen looks like when the sample data is loaded:

All logs are clearly visible and itemized. When you select a log line, you can view all of the meta field information that was logged at that time. This is due to the automatic parsing of log lines as they are ingested into the LogDNA platform:

You also have the option to view in context. When you click this option, you can see a slice of the logs within the particular context of source, per app, or both. View in Context allows you to see the log lines that have lead up to this event as well as the lines that occured after the event:

You can also filter the logs by level. This is especially useful for eliminating most of the irrelevant noise when debugging. You can select the filter levels from the dropdown options at the top and apply them to the main view:

Next, we’ll show you how to enroll a new application in the platform to test in development.
Enrolling a New Application
LogDNA supports ingestion from multiple sources using the LogDNA Agent, Syslog, Code Libraries, and APIs.In this example, we will enroll a Node.js application sourced from this repo.
You can follow the installation process as explained in the Readme. Then, you will need to hook the LogDNA logger into the Winston.js instance config.
Install the following packages:

Then modify the util/logger.ts file to include the LogDNA configuration:Then add an empty module definition for the logdna-winston package in

Then add an empty module definition for the logdna-winston package in

You will need to provide the secret API key for publishing logs in the logDNAOptions. This can be found in the Organization-> API Keys settings:

Once you have everything configured, you can start the development server and watch the dashboard as the new logs get populated:

Navigate to localhost:3000 and make sure to enable live monitoring in the LogDNA platform. This can be found at the bottom right of the LogDNA dashboard.

Now you can see the new entries. If you are having trouble finding them, you may want to filter by application first and then select the application name.


Let’s take a look at some of the other debugging utilities that LogDNA offers.
Debugging with LogDNA
LogDNA has several options and helpers for debugging applications. Let’s explore them briefly one by one.
Tracebacks
If you check one of the logs after you have finished the logging configuration, you will be able to see tracebacks. That’s because an error was thrown after the logger was configured and propagated into the platform. By looking at the error trace, you can clearly see that the origin was in the /dist/util/logger.js file.
Alerts
Alerts are crucial to any technology as they give us a heads up when something is happening within our environment. With alerts we can get notifications through various means with LogDNA. Out of the box LogDNA supports alerts that can be triggered through email, PagerDuty, and Slack to name a few. LogDNA also supports webhooks for alerting capabilities.
How do we set up an alert in LogDNA? Alerts start when we filter down our logs to a specific query we are interested in. Filtering can take place through several means within the platform, but for this example we will use the natural language query syntax to filter down 400 response errors that are typically specific to web applications.

Now that we have our filter in place it’s time to set up our alerting. For that you will notice that you will see your View change to ‘Unsaved View’ at the top of the Views page.

Clicking on the ‘Unsaved View’ will provide us options to save the View and attach an Alert to it. If you already had a saved View you would have the ability to attach an Alert to that existing View from this menu.
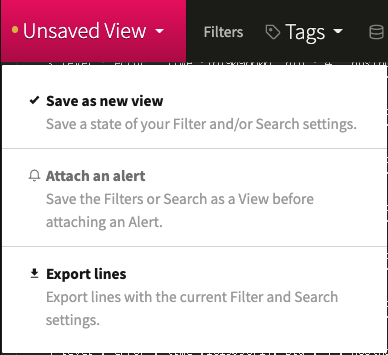
Let’s look at what happens when we click on ‘Save as new View’

Within the pop up window we can give the View a name, add it to a category, and attach an Alert to it. When we go and attach an Alert to our View we are presented with the screen below.

From here we can see the various alerting options that are provided out of the box, and also see the Webhook option as mentioned before. We will select email for our first option.

There is a lot to take in with the above screenshot so let’s walk through it piece by piece.

The first section is all about alerting off either the presence or absence of log lines. Think of presence as when I see a defined number of lines come in during a specified period I want to be alerted to this. Absence would be the opposite of that. If I’m expecting my application to generate X number of log lines but it dips below that then I want to be alerted as there may be issues with my application continuing to run and accept calls properly. We can also see when this Alert will be triggered based on our input with the gray line that runs across the display.
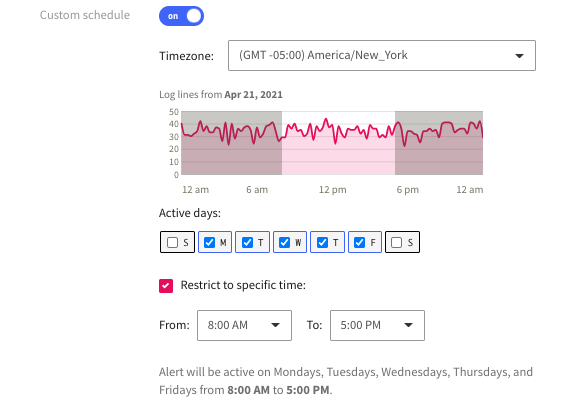
Next we can create custom schedules that define when this alert is to be triggered. For this example we can specify typical working hours of Monday through Friday from 8:00 am to 5:00 pm. This is useful as we can create alert escalations that are sent to one place during normal operation hours and another place after hours or on the weekends.
Alerting is crucial these days with such busy schedules, remote working, and it helps avoid things like context switching where you’d have to be monitoring a web UI all the time.
Boards and Screens
After setting up Alerts, you can create your own Board with custom widgets. For example, you can add a widget that uses only logs from a particular application:

In this example, if you select app and Typescript-Node, you will see the following graph:

Screens are similar to Boards, but they give you a birds-eye view of your widgets. You can place them wherever you like.

Time-Shifted Graphs
After you’ve written some application logic, you can revisit the application in specific time intervals to check if the reliability has improved. This can be accomplished by using Time-shifted Graphs. With this feature, you can compare log events across two different time spans. To do so, you begin by selecting a widget from a screen. Then, using the sidebar options, you can change the duration field to provide valuable insights about the rate of events:

These Graphs are excellent for development, since they demonstrate the general tendency of the log events after new test cases have been written or major code changes have been implemented.
Next Steps with LogDNA
In this article, we gave you a brief tour of the main development features of LogDNA’s platform. We showed you how to review tracebacks, view in context, use Live Tail, and set up LogDNA Alerts for fundamental errors. Together with Boards, Graphs, and Screens, this platform gives developers a comprehensive set of tools for debugging applications. You can also take it to the next level by using LogDNA for production environments – but we’ll explore that topic in another tutorial.
By Theo Despoudis
Source LogDNA
For enquiries, product placements, sponsorships, and collaborations, connect with us at [email protected]. We'd love to hear from you!
Our humans need coffee too! Your support is highly appreciated, thank you!