Spring Boot is a very popular microservice framework that significantly simplifies web application development by providing Java developers with a platform to get started with an auto-configurable, production-grade Spring application.
In this blog, we will walk through detailed steps on how you can observe a Spring Boot application, by instrumenting it with Prometheus and OpenTelementry and by collecting and correlating logs, metrics, and traces from the application in Grafana Cloud.
From our partners:
More specifically, we will:
- Use OpenTelemetry to instrument a simple Spring Boot application, Hello Observability, and ship the traces to Grafana Cloud using Grafana Agent.
- Automatically log every request to the application, and ship these logs to Grafana Cloud using Grafana Agent. Then correlate logs with traces and metrics from the application.
- Use Prometheus to instrument the application so that we can collect metrics, and correlate the metrics with traces leveraging Grafana’s exemplars.
Very exciting! Let me first introduce the wonderfully simple Spring Boot application, Hello Observability.
Intro to the Spring Boot application
The Hello Observability application is extremely simple. It mainly contains one Java class HelloObservabilityBootApp, which contains two methods that can serve HTTP requests.

Clone the repository to look at the code, then build the application and the application container:
git clone https<span class="token operator">:</span><span class="token operator">/</span><span class="token operator">/</span>github<span class="token punctuation">.</span>com<span class="token operator">/</span>adamquan<span class="token operator">/</span>hello<span class="token operator">-</span>observability<span class="token punctuation">.</span>git
cd hello<span class="token operator">-</span>observability<span class="token operator">/</span>hello<span class="token operator">-</span>observability
<span class="token punctuation">.</span><span class="token operator">/</span>mvnw <span class="token keyword">package</span>
docker build <span class="token operator">-</span>t hello<span class="token operator">-</span>observability <span class="token punctuation">.</span>
You can then run the application directly and access it here: http://localhost:8080/hello. Very simple application, indeed!
java -jar target/*.jar

You can also run it inside a Docker container with the following command, and access the application here: http://localhost:8080/hello
docker run -d -p 8080:8080 --name hello-observability hello-observability
Stop the docker container using the following command:
docker stop hello-observability
We have not done any instrumentation to collect logs, metrics, and traces so far. To do so, you will have to start all services using docker-compose. All configurations needed to generate and collect logs, metrics, and traces are already configured.
Let’s now run the whole stack locally inside Docker to see it in action. The whole stack contains:
- The Hello Observability application
- A simple load runner
- Prometheus for metrics
- Grafana Loki for logs
- Grafana Tempo for traces
- Grafana Agent to collect logs, metrics, and traces
- Grafana
cd hello<span class="token operator">-</span>observability<span class="token operator">/</span>local
docker<span class="token operator">-</span>compose up
After all the containers are up, you can access the application here: http://localhost:8080/hello, and Grafana here: http://localhost:3000. A dashboard called Hello Observability is also pre-loaded.
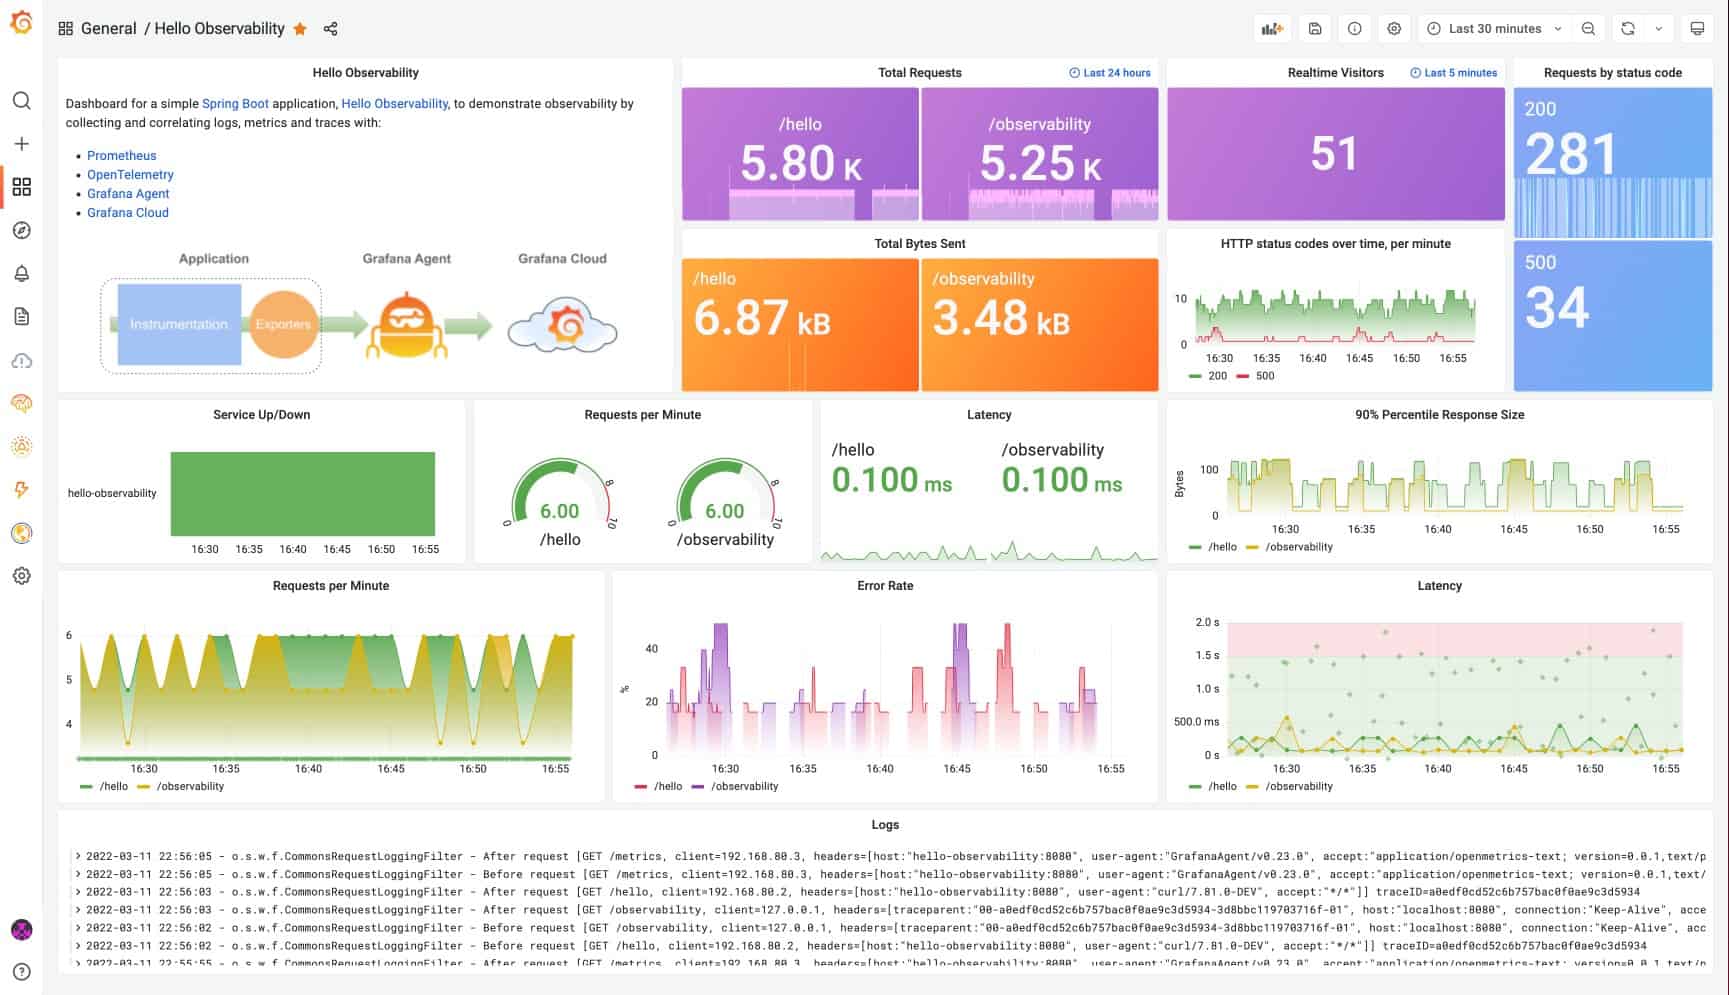
Hope this gets you excited! We will do a quick introduction of Grafana Cloud and Grafana Agent next, before looking at the instrument details.
How to configure Grafana Cloud
Grafana Cloud is a fully-managed composable observability platform that integrates metrics, traces, and logs with Grafana. With Grafana Cloud, you can leverage the best open source observability software, including Prometheus, Grafana Loki, and Grafana Tempo, without the overhead of installing, maintaining, and scaling your observability stack. This allows you to focus on your data and the business insights they surface, not the infrastructure stack storing and serving the data.
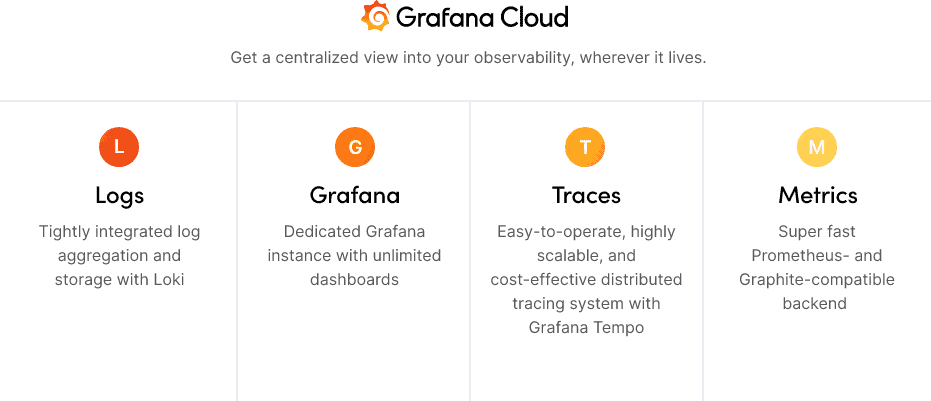
Grafana Cloud’s free plan makes it accessible for everybody. On top of being free, the plan also gives you access to advanced capabilities like Grafana OnCall, Synthetic monitoring, and Alerting. Create your free account to follow along!
To send logs, metrics, and traces to Grafana Cloud, we need to gather our Grafana Cloud connection information for Loki, Prometheus, and Tempo, so that we can configure our Agent accordingly. That’s what we will do next.
Connect Grafana Cloud Traces
Grafana Cloud Traces is the fully-managed, highly-scalable, and cost-effective distributed tracing system based on Grafana Tempo. That’s where our traces will go.
Tempo connection information includes endpoint URL and user credentials. Navigate to grafana.com and login. Make sure you select the right account from the account dropdown. My account name is aquan. Click on My Account, then Send Traces in the Tempo section.
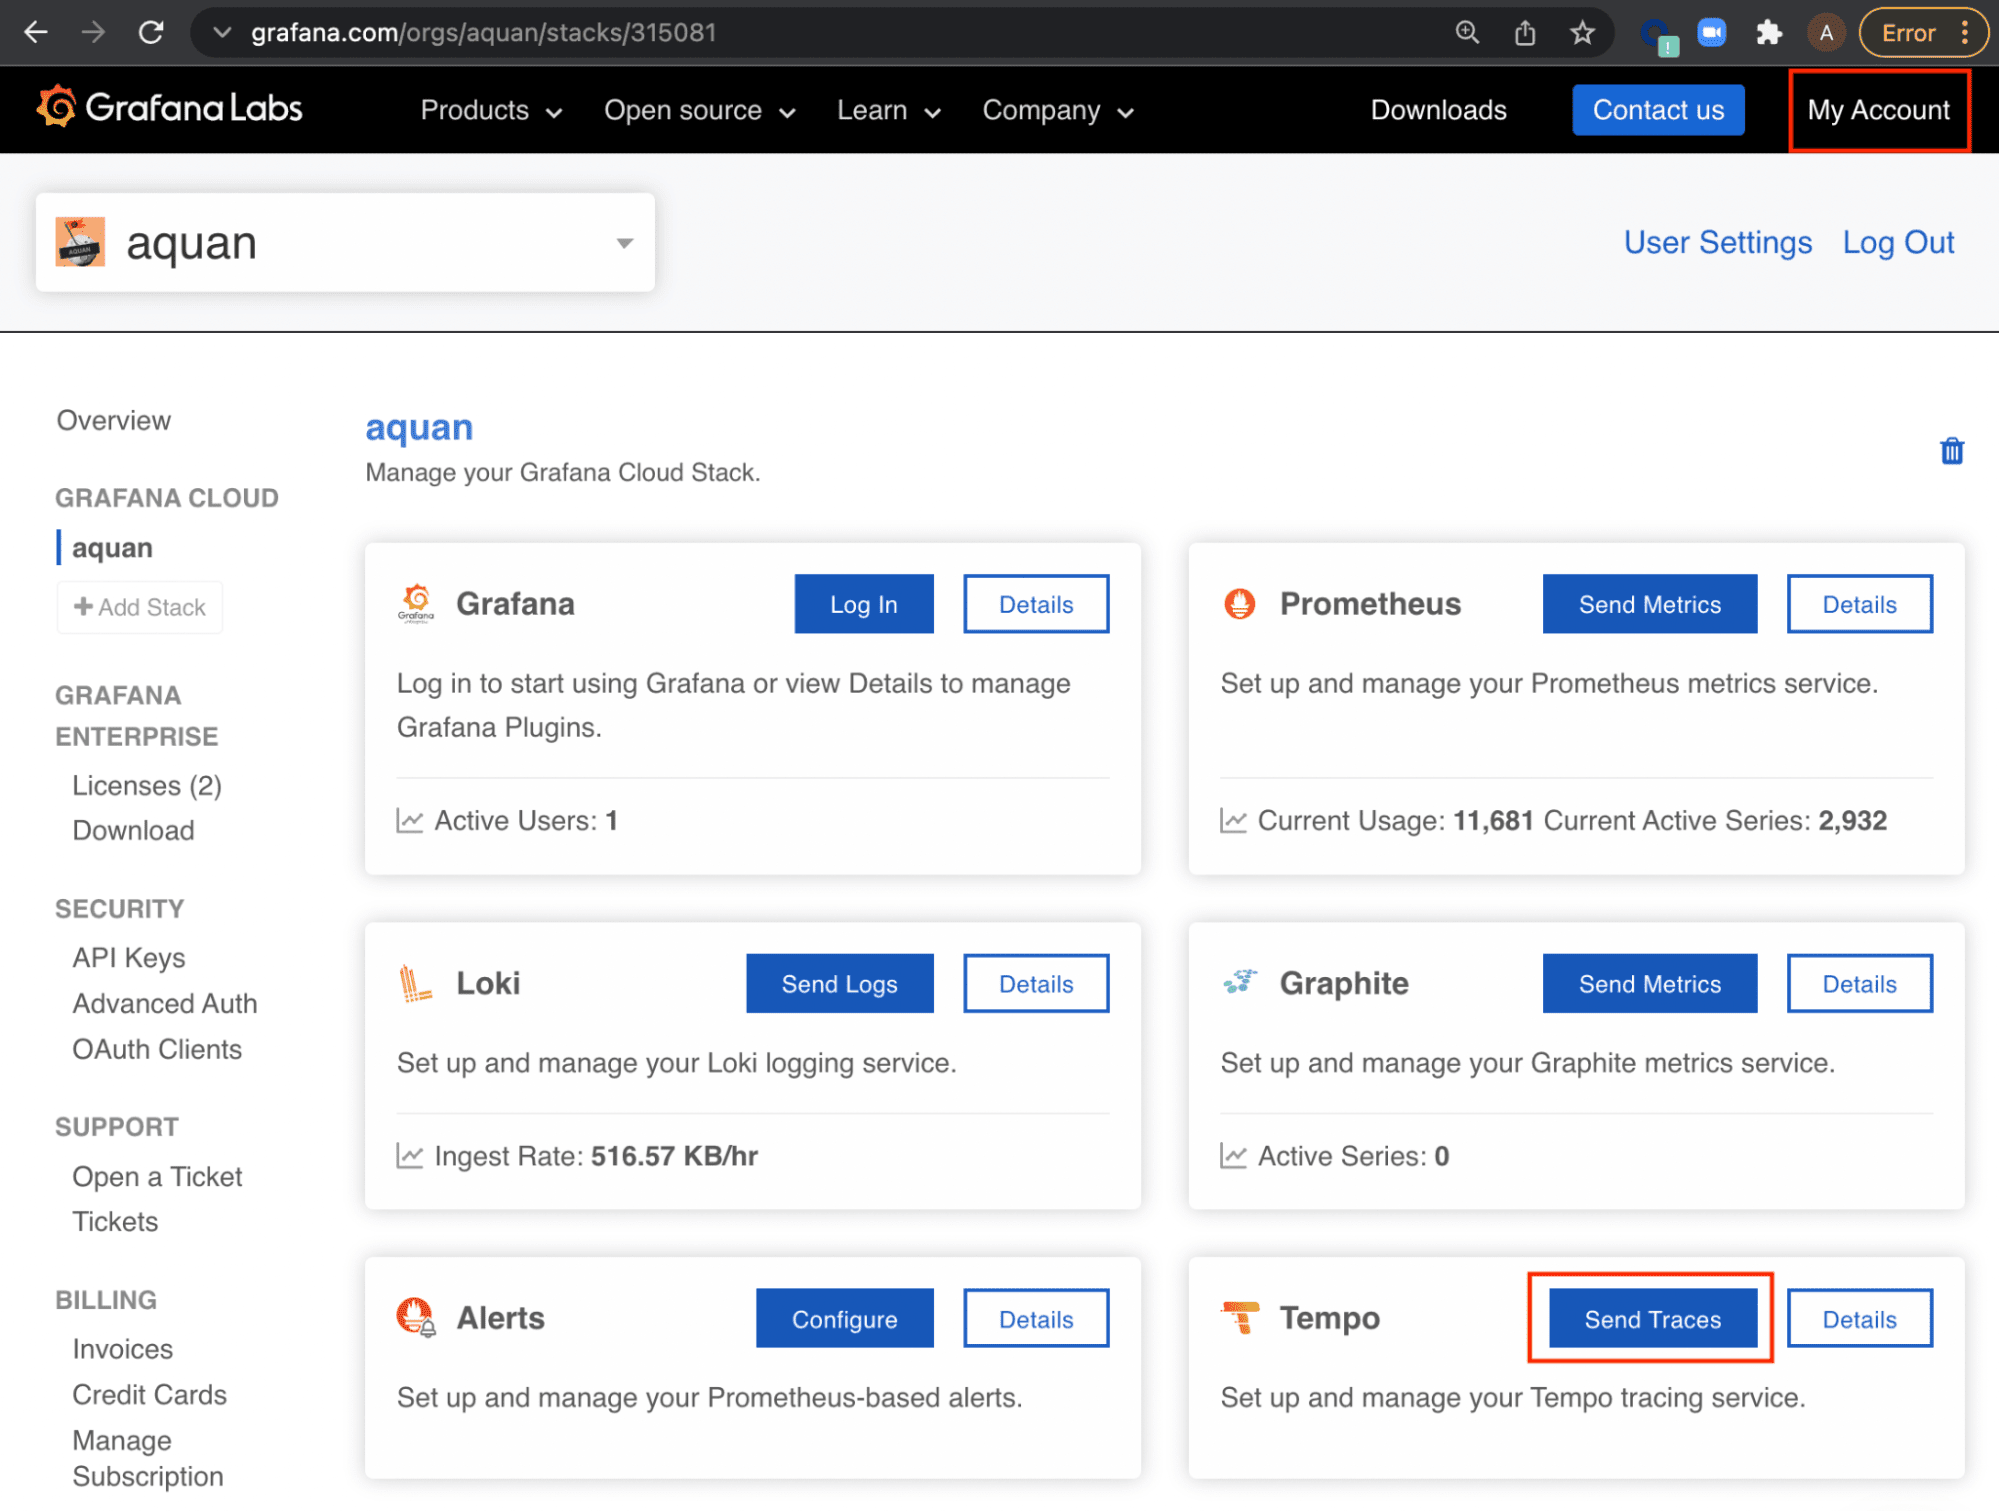
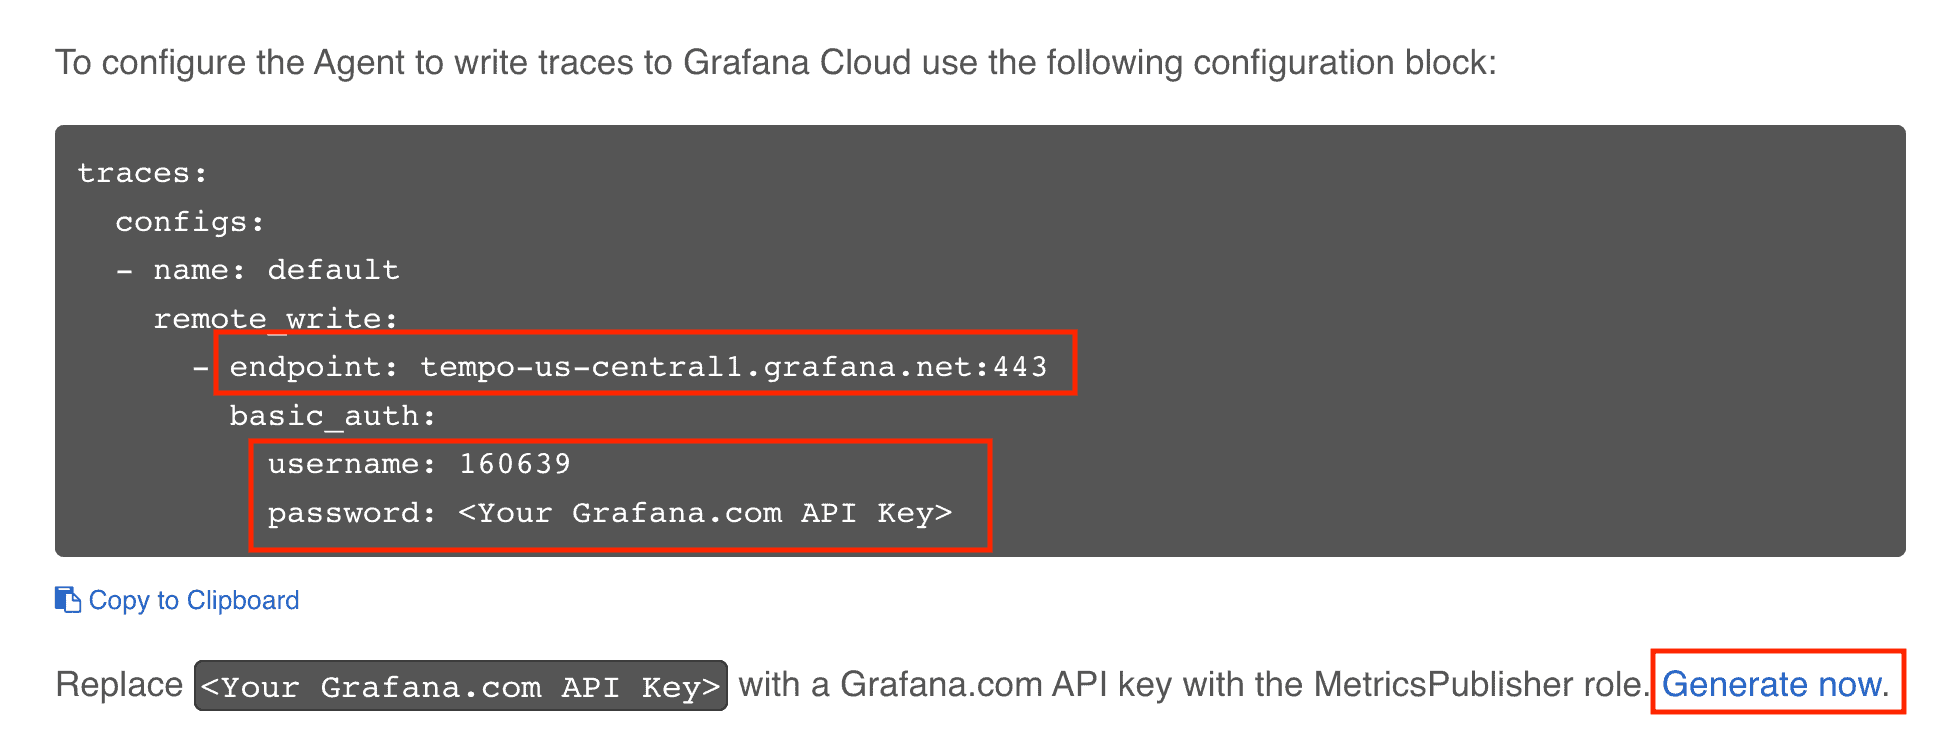
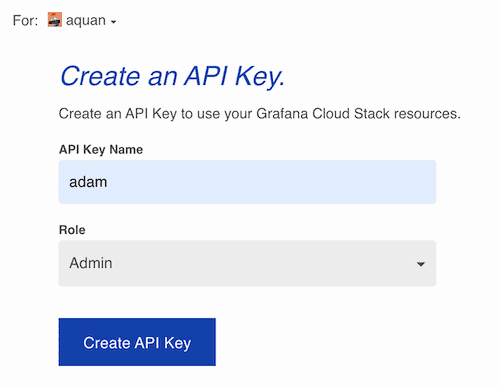
You should see something like the screenshot below, with information about the endpoint and user credentials. You can generate a new API Key by clicking on the Generate now link or navigate to the Security → API Keys section.
Either way, the API Key creation screens look like below. (No worry about me exposing my API Key. It’s already deleted.)
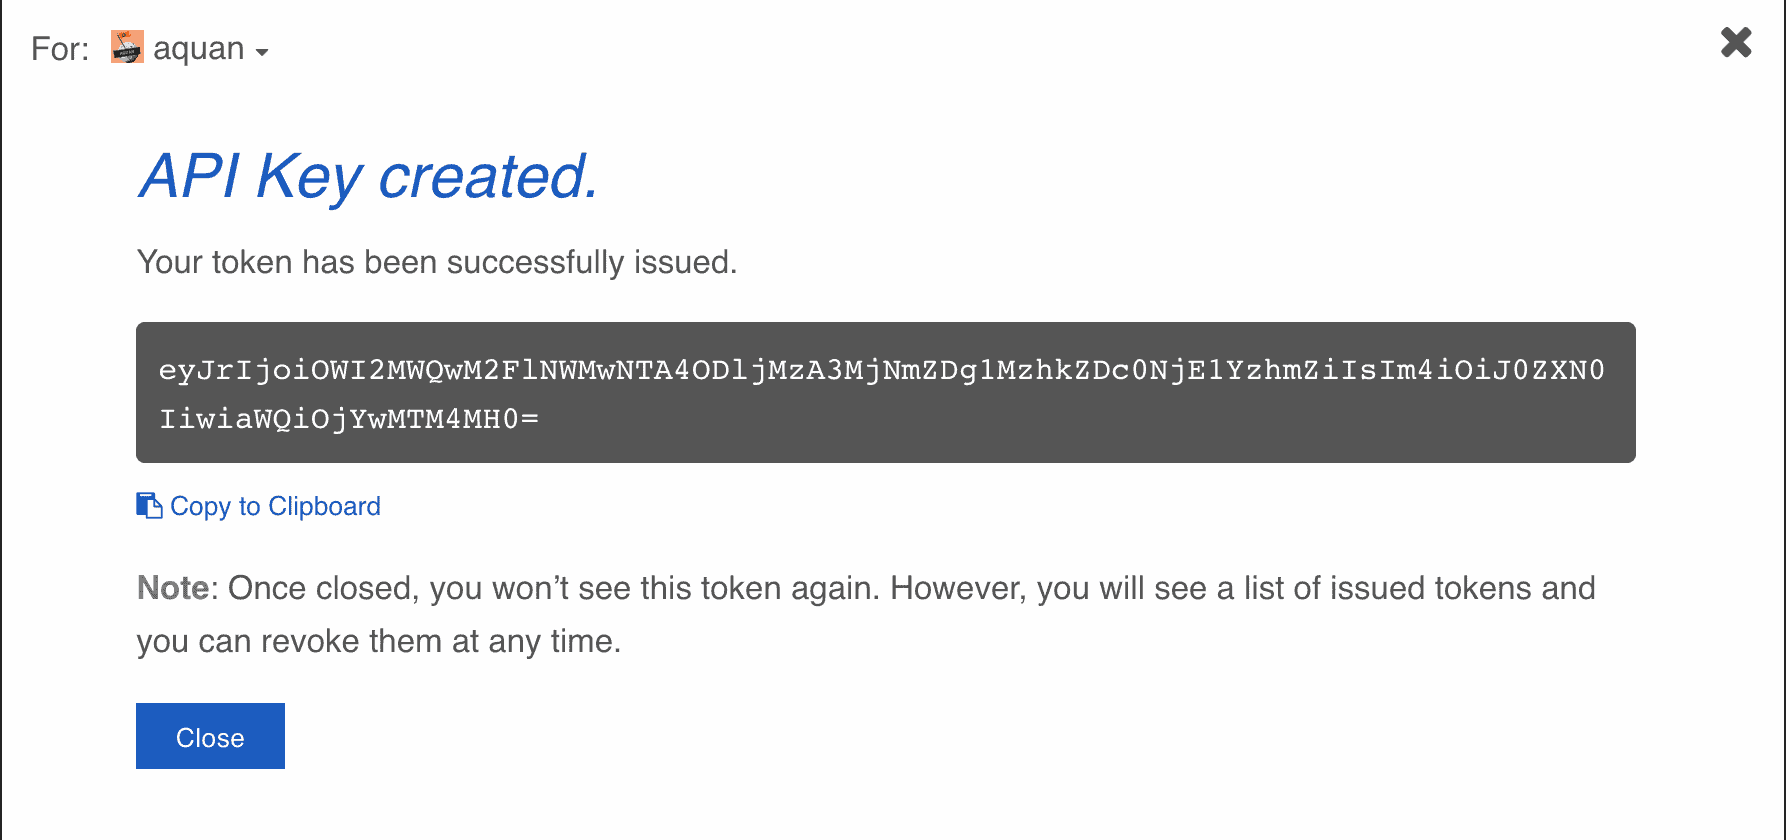
In this case, here is the Tempo information for my Grafana Cloud account:
- Endpoint:
https://tempo-us-central1.grafana.net:443 - User:
160639 - API Key:
eyJrIjoiZGNjYjFjMzFjMTQ2YTA4MmI3YzhiMWRhNDdlOTFhNmJiNGE5OTRmMyIsIm4iOiJhZGFtIiwiaWQiOjYwMTM4MH0=
Connect Grafana Cloud Logs
Grafana Cloud Logs is Grafana’s fully-managed logging solution based on Grafana Loki. Loki is a horizontally-scalable, highly-available, multi-tenant log aggregation solution inspired by Prometheus. It is designed to be cost-effective and easy to operate. It does not index the contents of the logs, but rather a set of labels for each log stream.
Similar as you have done for Tempo connection information, we can collect Loki connection information from the Loki section in my account page:
- Endpoint:
https://logs-prod3.grafana.net/loki/api/v1/push - User:
164126 - API Key:
eyJrIjoiOWYzMmViNDMwNGMzZjM5ZDZjY2JiZTUwZDI4YTlmMDY3MTlkZGM3YSIsIm4iOiJhcXVhbi1lYXN5c3RhcnQtcHJvbS1wdWJsaXNoZXIiLCJpZCI6NjAxMzgwfQ==
Connect Grafana Cloud Metrics
Finally, for Grafana Cloud Metrics, we can get all the connection information from the Prometheus section in my account page:
- Endpoint:
https://prometheus-prod-10-prod-us-central-0.grafana.net/api/prom/push - User:
330312 - API Key:
eyJrIjoiOWYzMmViNDMwNGMzZjM5ZDZjY2JiZTUwZDI4YTlmMDY3MTlkZGM3YSIsIm4iOiJhcXVhbi1lYXN5c3RhcnQtcHJvbS1wdWJsaXNoZXIiLCJpZCI6NjAxMzgwfQ==
With all the connection information collected, we are ready to configure our Grafana Agent so that the agent can send our logs, metrics, and traces to Grafana Cloud.
How to configure the Grafana Agent
Grafana Agent is an all-in-one agent for collecting metrics, logs, and traces. It removes the need to install more than one piece of software by including common integrations for monitoring out of the box. Grafana Agent makes it easy to send telemetry data and is the preferred telemetry collector for sending metrics, logs, and trace data to the opinionated Grafana observability stack, both on-prem and in Grafana Cloud.

All the agent configuration information is inside the agent.yaml file. Let’s see exactly how the agent is configured.
Configure traces
In the context of tracing, Grafana Agent is commonly used as a tracing pipeline, offloading traces from the application and forwarding them to a storage backend. The Grafana Agent supports receiving traces in multiple formats: OpenTelemetry (OTLP), Jaeger, Zipkin, and OpenCensus.

Here is the traces section from the Grafana Agent configuration file. Other than the Grafana Cloud Tempo URL and authentication information, we are basically saying the agent is expecting traces in OTLP format over the HTTP protocol. You can also configure it to use Jaeger format if you like, but we recommend the OTLP format.
traces:
  configs:
  - name: default
    remote_write:
      - endpoint: tempo-us-central1.grafana.net:443
        basic_auth:
          username: 160639
          password: <span class="token tag"><span class="token punctuation"><</span>API_KEY<span class="token punctuation">></span></span>
    receivers:
      otlp:
        protocols:
          http:
Configure logs
The following is the clients section of the agent.yaml file, which contains all the connection information we collected before.
clients:
  - url: https://logs-prod3.grafana.net/loki/api/v1/push
    basic_auth:
      username: 164126
      password: <span class="token tag"><span class="token punctuation"><</span>API_KEY<span class="token punctuation">></span></span>
Configure metrics
In the metrics section, remote_write contains all the connection information. The scrape_configs section defines the scrape jobs, which we will discuss later.
   remote_write:
    - basic_auth:
        username: 330312
        password: <span class="token tag"><span class="token punctuation"><</span>API_KEY<span class="token punctuation">></span></span>
      url: https://prometheus-prod-10-prod-us-central-0.grafana.net/api/prom/push
Let’s move on and see how the instruments are done and how logs, metrics, and traces are collected. We will start with OpenTelemetry traces.
How to instrument Spring Boot with OpenTelemetry
The open source observability framework, OpenTelemetry, is gaining popularity very quickly. OpenTelemetry is the result of merging OpenTracing and OpenCensus. As of writing today, traces are the most mature component of OpenTelemetry, and logs are still experimental. We will focus on the tracing aspect of OpenTelemetry in this blog.
OpenTelemetry is a collection of APIs, SDKs, and tools that you can use to instrument, generate, collect, and export telemetry data that can in turn help you analyze your software’s performance and behavior. OpenTelemetry is both vendor and platform agnostic, which is one of the reasons it’s getting popular very quickly.
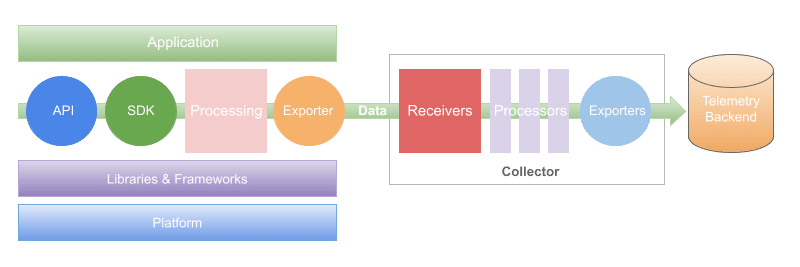
In general, instrumentation can be done in three different places: your application code; libraries and frameworks your application depends on; and the underlying platform, such as Kubernetes, Envoy, or Istio. The nice thing about OpenTelemetry is that instrumentations are already done in many popular libraries and frameworks, such as Spring, Express, etc.
Something that is worth noting is the auto-instrumentation capability of OpenTelementry. Auto-instrumentation allows developers to collect telemetry data without making any code changes. We will be leveraging the auto-instrumentation capability of the Java Agent to instrument our Hello Observability application, with no code change necessary.
Auto-instrumentation with the Java Agent
The OpenTelemetry Java Agent can be attached to any Java 8+ application for auto-instrumentation. It dynamically injects bytecode to capture telemetry from many popular libraries and frameworks. Once attached, it automatically captures telemetry data at the edges of applications and services, such as inbound requests, outbound HTTP calls, database calls, and others. If you want to instrument application code in your applications or services in other custom ways, you will have to use manual instrumentation.
With the wonderful auto-instrumentation capability of the Java Agent, instrumenting our Spring Boot application is very straightforward. We simply need to include the -javagent:./opentelemetry-javaagent.jar option when running the application. The hello-observability application service inside cloud/docker-compose.yaml file looks like:
  hello-observability:
    image: hello-observability
    volumes:
      - ./logs/hello-observability.log:/tmp/hello-observability.log
      - ./logs/access_log.log:/tmp/access_log.log
    environment:
	JAVA_TOOL_OPTIONS: -javaagent:./opentelemetry-javaagent.jar
      OTEL_EXPORTER_OTLP_TRACES_ENDPOINT: http://agent:4317
      OTEL_SERVICE_NAME: hello-observability
      OTEL_TRACES_EXPORTER: otlp
    ports:
      - "8080:8080"
Notice that we are passing in the Java Agent jar file with the -javaagent option, as an environment variable for the docker container. The repo already contains an up-to-date agent, as of this writing. If you want, you can also download the latest version of the agent, and copy it into the hello-observability directory.
The other three environment variables are used to tell where and how to send traces. See OpenTelemetry Java Agent Configuration for details about the system properties and environment variables that you can use to configure the agent.
- OTEL_TRACES_EXPORTER: The exporter for tracing. We are using the OpenTelemetry exporter by setting it to
otlp. - OTEL_EXPORTER_OTLP_TRACES_ENDPOINT: The OTLP traces endpoint to connect to. Since we are sending the traces to Grafana Cloud through the Grafana Agent, we need to set it to the agent URL. Notice the port number
4317. - OTEL_SERVICE_NAME: A service name to identify our application. We are simply setting it to our application name
hello-observability.
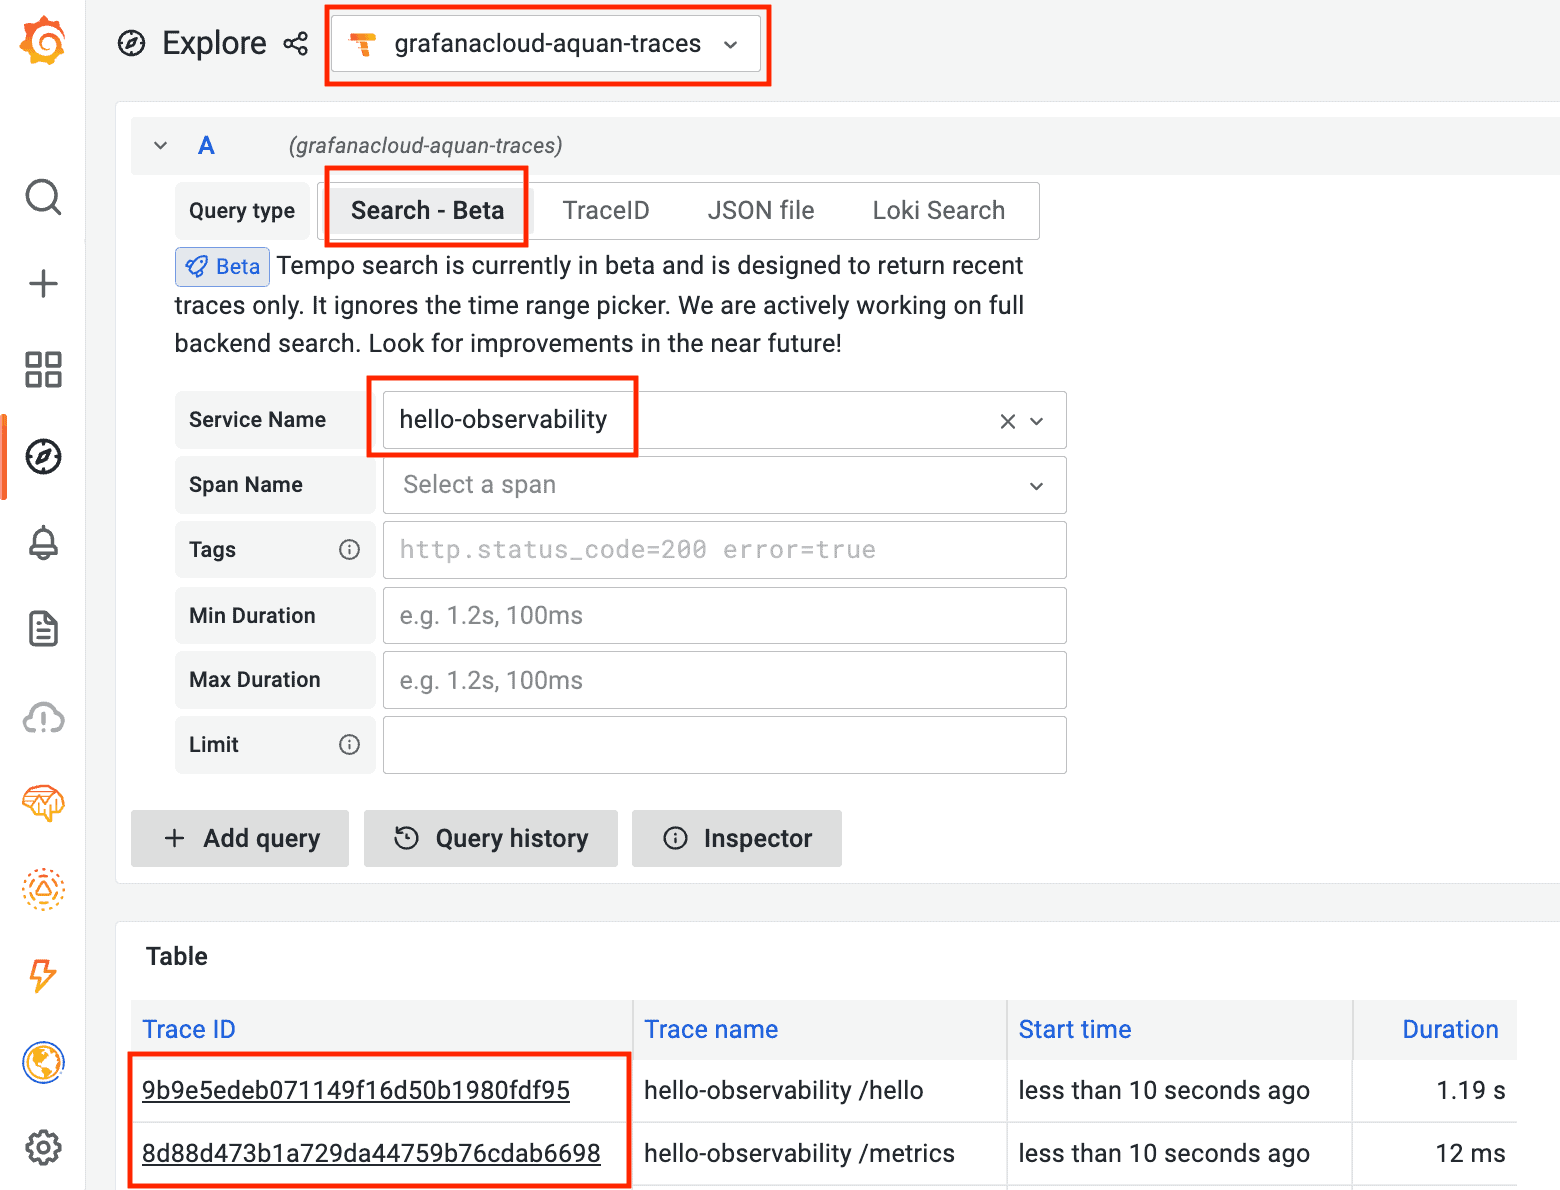
While the application is running, log into your Grafana Cloud account. Select your Tempo data source from Explore. In my case, it’s called grafanacloud-aquan-traces. See your traces by clicking on the Search button and selecting hello-observability for Service Name. Remember we set OTEL_SERVICE_NAME to hello-observability?
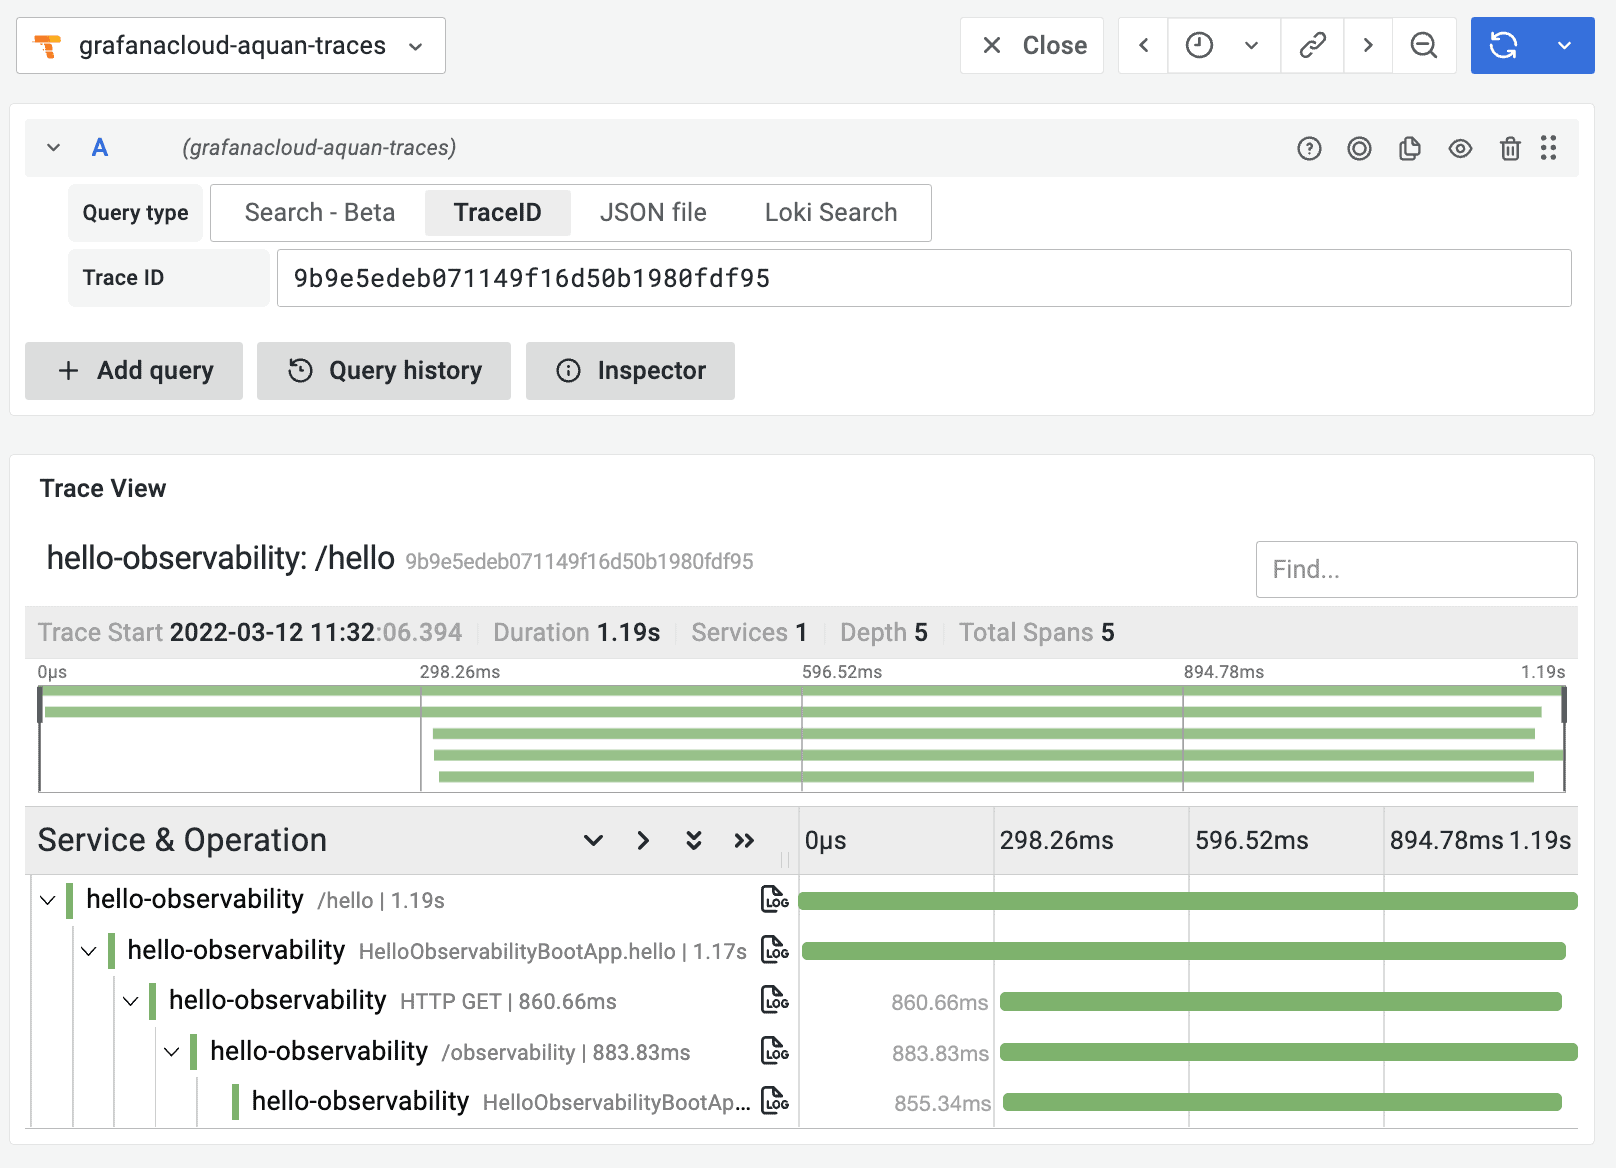
Click on one of them to see the waterfall visualization of the trace. Later, once we have logs and metrics shipped to Grafana Cloud too, you will be able to correlate logs, metrics, and traces together! The power of a unified observability platform!
If you are running everything locally, you will also be able to see the bonus Node Graph, which is still in beta, as of writing.
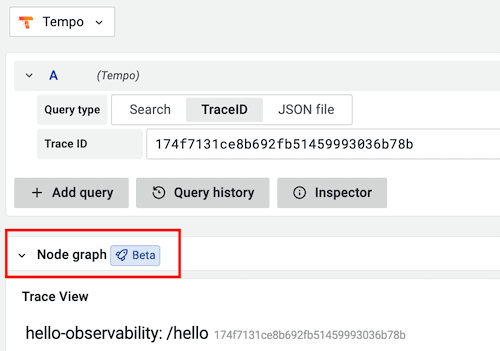
This is what the node graph for the trace above looks like:

Collecting logs and correlating with traces
With traces coming in, let’s also collect logs from the application and see how we can correlate logs with traces.
Spring Boot has built-in support for automatic request logging. The CommonsRequestLoggingFilter class can be used to log incoming requests. You just need to configure it by adding a bean definition. We have the following Java class definition in our source code directory, in a file called RequestLoggingFilterConfig.java.
<span class="token annotation punctuation">@Configuration</span>
<span class="token keyword">public</span> <span class="token keyword">class</span> <span class="token class-name">RequestLoggingFilterConfig</span> <span class="token punctuation">{</span>
	<span class="token annotation punctuation">@Bean</span>
	<span class="token keyword">public</span> <span class="token class-name">CommonsRequestLoggingFilter</span> <span class="token function">logFilter</span><span class="token punctuation">(</span><span class="token punctuation">)</span> <span class="token punctuation">{</span>
		<span class="token class-name">CommonsRequestLoggingFilter</span> filter <span class="token operator">=</span>
<span class="token keyword">new</span> <span class="token class-name">CommonsRequestLoggingFilter</span><span class="token punctuation">(</span><span class="token punctuation">)</span><span class="token punctuation">;</span>
		filter<span class="token punctuation">.</span><span class="token function">setIncludeQueryString</span><span class="token punctuation">(</span><span class="token boolean">true</span><span class="token punctuation">)</span><span class="token punctuation">;</span>
		filter<span class="token punctuation">.</span><span class="token function">setIncludeHeaders</span><span class="token punctuation">(</span><span class="token boolean">true</span><span class="token punctuation">)</span><span class="token punctuation">;</span>
		filter<span class="token punctuation">.</span><span class="token function">setIncludeClientInfo</span><span class="token punctuation">(</span><span class="token boolean">true</span><span class="token punctuation">)</span><span class="token punctuation">;</span>
		<span class="token keyword">return</span> filter<span class="token punctuation">;</span>
	<span class="token punctuation">}</span>
<span class="token punctuation">}</span>
This logging filter also requires the log level to be set to DEBUG. Here is what the application.properties file looks like:
logging<span class="token punctuation">.</span>file<span class="token punctuation">.</span>name<span class="token operator">=</span><span class="token operator">/</span>tmp<span class="token operator">/</span>hello<span class="token operator">-</span>observability<span class="token punctuation">.</span>log
logging<span class="token punctuation">.</span>level<span class="token punctuation">.</span>org<span class="token punctuation">.</span>springframework<span class="token operator">=</span>INFO
<span class="token class-name"><span class="token namespace">logging<span class="token punctuation">.</span>level<span class="token punctuation">.</span>org<span class="token punctuation">.</span>springframework<span class="token punctuation">.</span>web<span class="token punctuation">.</span>filter<span class="token punctuation">.</span></span>CommonsRequestLoggingFilter</span><span class="token operator">=</span>DEBUG
logging<span class="token punctuation">.</span>pattern<span class="token punctuation">.</span>file<span class="token operator">=</span><span class="token operator">%</span>d<span class="token punctuation">{</span>yyyy<span class="token operator">-</span>MM<span class="token operator">-</span>dd HH<span class="token operator">:</span>mm<span class="token operator">:</span>ss<span class="token punctuation">}</span> <span class="token operator">-</span> <span class="token operator">%</span>msg traceID<span class="token operator">=</span><span class="token operator">%</span><span class="token class-name">X</span><span class="token punctuation">{</span>trace_id<span class="token punctuation">}</span> <span class="token operator">%</span>n
We are telling Spring Boot to write logs into the /tmp/hello-observability.log log file, with information about the date/time, the log message, and the trace ID. Of particular interest is the trace_id. It allows us to correlate the logs with traces we collected before automatically, as you will see later.
If you look at the hello-observability.log log file, you should see log lines like these. Notice the trace ID?
<span class="token number">2022</span><span class="token operator">-</span><span class="token number">03</span><span class="token operator">-</span><span class="token number">11</span> <span class="token number">18</span><span class="token operator">:</span><span class="token number">15</span><span class="token operator">:</span><span class="token number">56</span> <span class="token operator">-</span> <span class="token class-name">After</span> request <span class="token punctuation">[</span>GET <span class="token operator">/</span>hello<span class="token punctuation">,</span> client<span class="token operator">=</span><span class="token number">192.168</span><span class="token number">.80</span><span class="token number">.2</span><span class="token punctuation">,</span> headers<span class="token operator">=</span><span class="token punctuation">[</span>host<span class="token operator">:</span><span class="token string">"hello-observability:8080"</span><span class="token punctuation">,</span> user<span class="token operator">-</span>agent<span class="token operator">:</span><span class="token string">"curl/7.81.0-DEV"</span><span class="token punctuation">,</span> accept<span class="token operator">:</span><span class="token string">"*/*"</span><span class="token punctuation">]</span><span class="token punctuation">]</span> traceID<span class="token operator">=</span>f179e69bd5f342233b9bc66728901f7f
Sending the logs to Grafana Cloud using the Grafana Agent is super simple. Please refer to the documentation Collect logs with Grafana Agent for details. Here is the scrape_configs section inside the agent.yaml file for logs:
    scrape_configs<span class="token operator">:</span>
      <span class="token operator">-</span> job_name<span class="token operator">:</span> hello<span class="token operator">-</span>observability
        static_configs<span class="token operator">:</span>
          <span class="token operator">-</span> targets<span class="token operator">:</span> <span class="token punctuation">[</span>localhost<span class="token punctuation">]</span>
            labels<span class="token operator">:</span>
              job<span class="token operator">:</span> hello<span class="token operator">-</span>observability
              __path__<span class="token operator">:</span> <span class="token operator">/</span>tmp<span class="token operator">/</span>hello<span class="token operator">-</span>observability<span class="token punctuation">.</span>log
      <span class="token operator">-</span> job_name<span class="token operator">:</span> tomcat<span class="token operator">-</span>access
        static_configs<span class="token operator">:</span>
          <span class="token operator">-</span> targets<span class="token operator">:</span> <span class="token punctuation">[</span>localhost<span class="token punctuation">]</span>
            labels<span class="token operator">:</span>
              job<span class="token operator">:</span> tomcat<span class="token operator">-</span>access
              __path__<span class="token operator">:</span> <span class="token operator">/</span>tmp<span class="token operator">/</span>access_log<span class="token punctuation">.</span>log
As you can see, the Agent is reading logs from the hello-observability.log file. We are also enabling and collecting Tomcat access logs from the application, so that we can create some interesting visualizations off it. Here is the section inside application.properties that configures Tomcat access logs. We are basically writing the access logs to /tmp/access_log.log file. That’s also where the Grafana Agent picks it up. Both the application container and the agent container can see that same file through docker volume mounts.
server<span class="token punctuation">.</span>tomcat<span class="token punctuation">.</span>accesslog<span class="token punctuation">.</span>enabled<span class="token operator">=</span><span class="token boolean">true</span>
server<span class="token punctuation">.</span>tomcat<span class="token punctuation">.</span>accesslog<span class="token punctuation">.</span>rotate<span class="token operator">=</span><span class="token boolean">false</span>
server<span class="token punctuation">.</span>tomcat<span class="token punctuation">.</span>accesslog<span class="token punctuation">.</span>suffix<span class="token operator">=</span><span class="token punctuation">.</span>log
server<span class="token punctuation">.</span>tomcat<span class="token punctuation">.</span>accesslog<span class="token punctuation">.</span>prefix<span class="token operator">=</span>access_log
server<span class="token punctuation">.</span>tomcat<span class="token punctuation">.</span>accesslog<span class="token punctuation">.</span>directory<span class="token operator">=</span><span class="token operator">/</span>tmp
server<span class="token punctuation">.</span>tomcat<span class="token punctuation">.</span>accesslog<span class="token punctuation">.</span>pattern<span class="token operator">=</span>common
Go to Grafana Cloud, then Explore, and select the Loki data source. In my case, it’s called grafanacloud-aquan-logs. Use the Log browser to select the hello-observability job. Then click on Show logs.
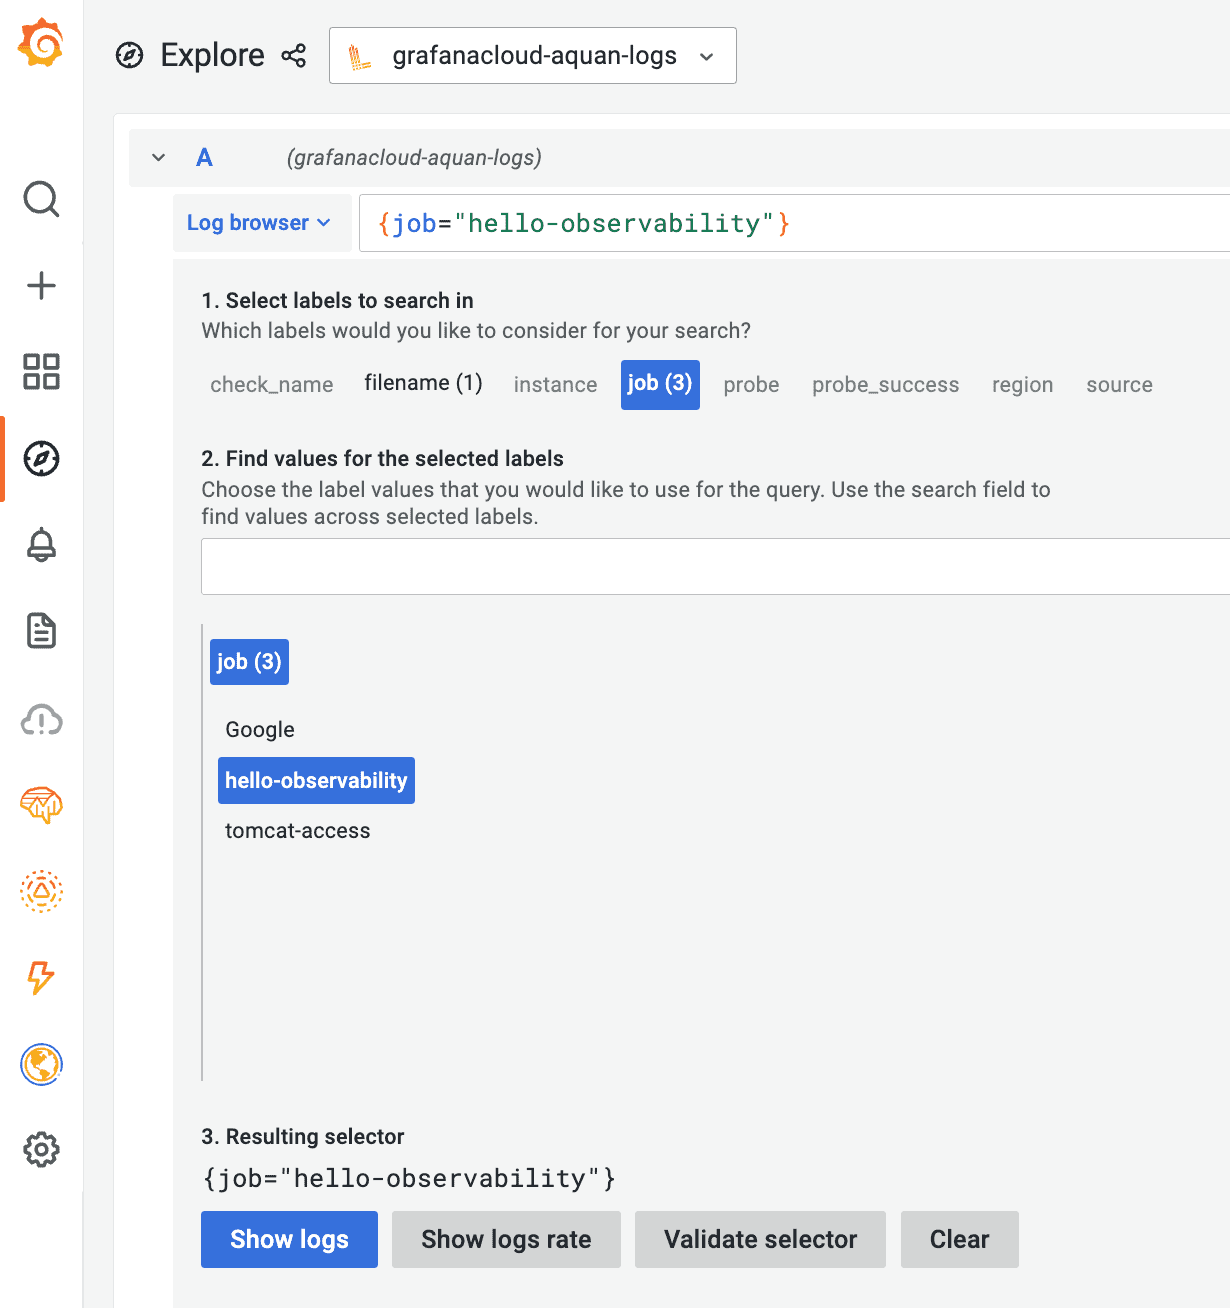
You should see some log lines. Expand one of the log lines and click on grafanacloud-quan-traces, you should see something like this below. The magical correlation between the logs and traces all done automatically because of the trace ID!
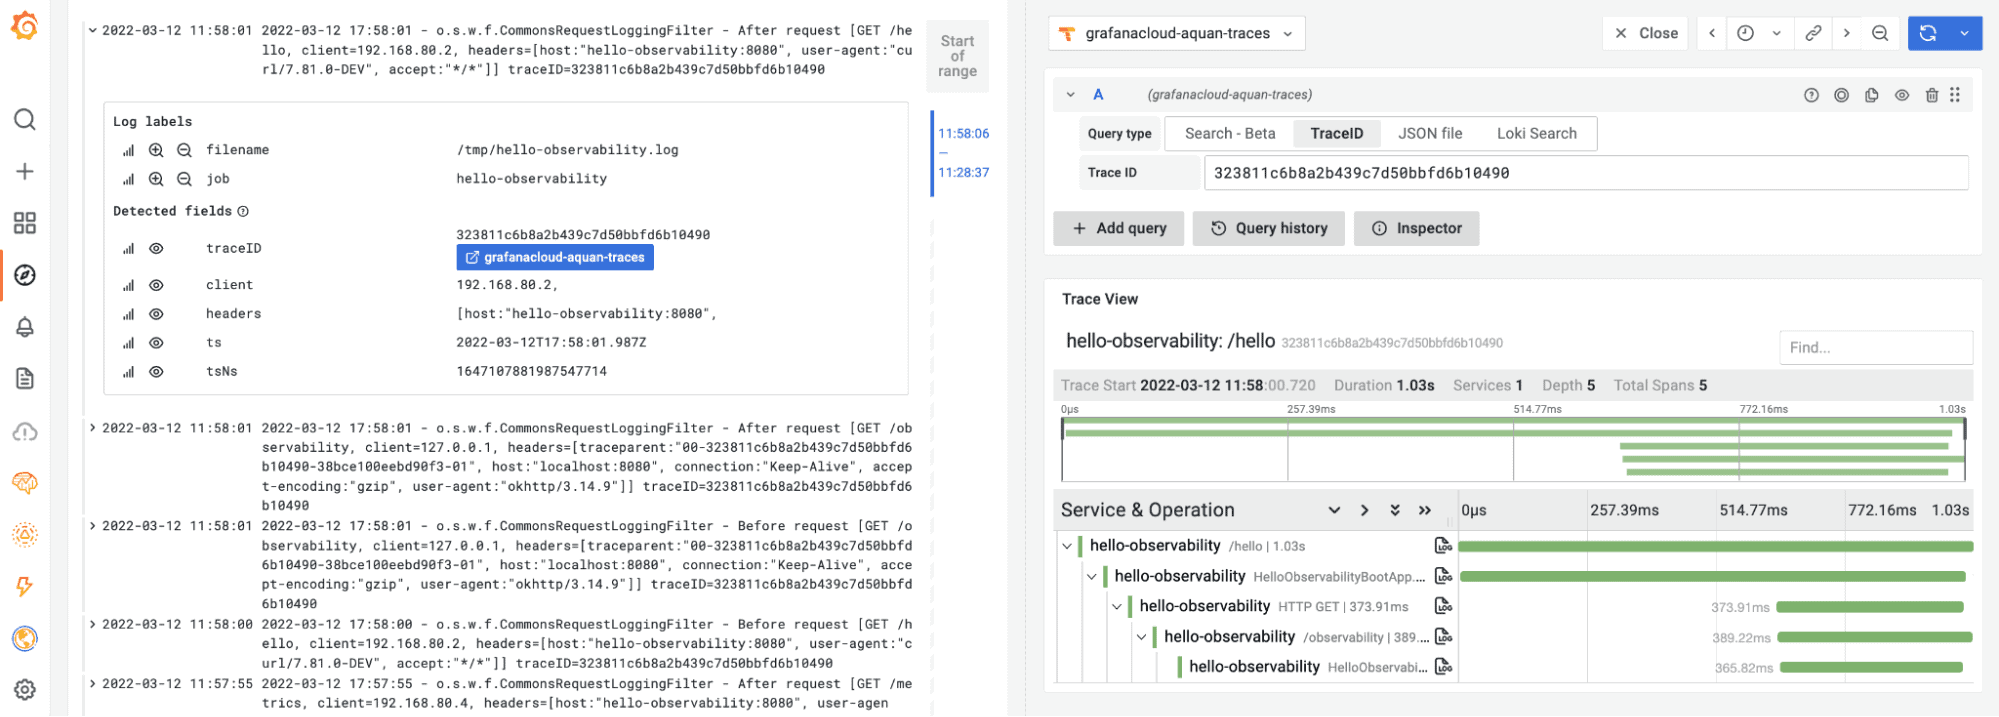
Let’s now complete our observability story by collecting metrics.
Instrumenting Spring Boot with Prometheus
Grafana Cloud has a Spring Boot integration that can send Spring Boot application metrics to Grafana Cloud along with an out-of-the-box dashboard for visualization.
Spring Boot also has built-in support for metrics collection through Micrometer. However, as of today, Micrometer does not support exemplars yet. Since we want to showcase the exemplar capability of Grafana, we will use Prometheus to instrument our application directly to collect performance metrics, instead of using the Spring Boot integration. (Grafana Labs product manager Jen Villa has a nice blog post about exemplars.)
Take a look at the HelloObservabilityBootApp Java class. We are basically instrumenting our simple application with a Counter, a Gauge, a Histogram, and a Summary, solely for demonstration purposes.
Make sure the application is running. Go to Grafana Cloud, and the Hello Observability dashboard. The Requests per Minute visualization shows Prometheus metrics with exemplars, which are the green dots.
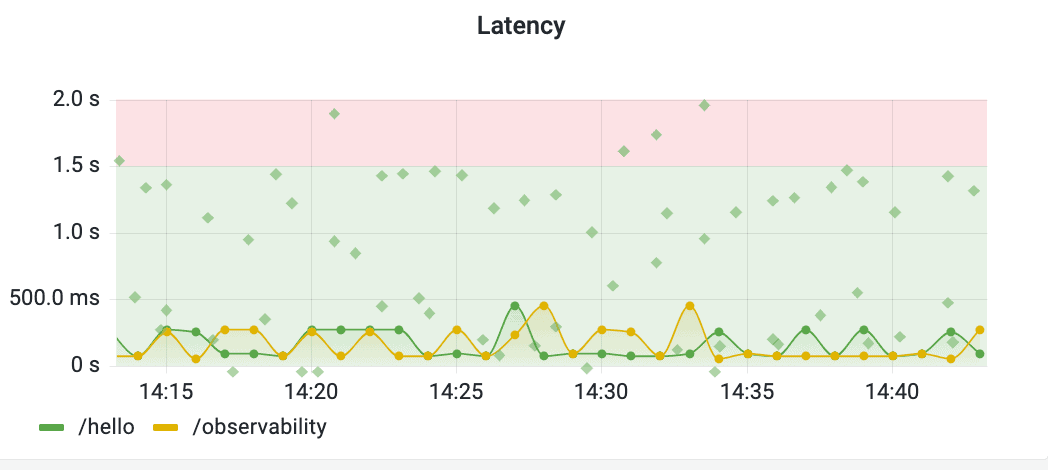
Mouse over one of them, and you will see a pop-up panel with a trace_id label that has a link to take you to the trace directly. The power of exemplars!
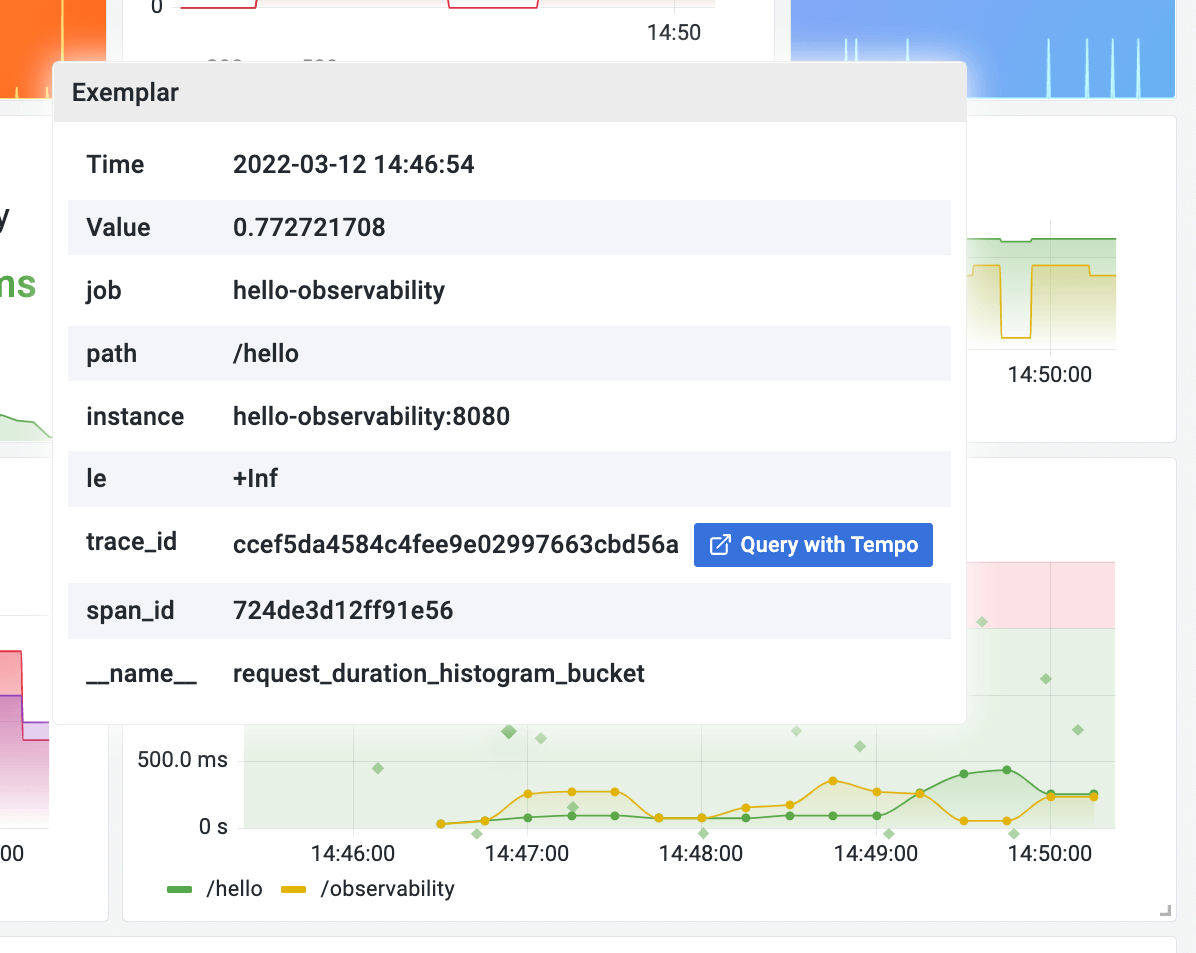
If you are curious about the metrics with exemplars collected by Prometheus, send a request to http://localhost:9090/api/v1/query_exemplars?query={job=”hello-observability”} and check it out. It will look something like the following. The exemplars are set as metadata labels, as span_id and trace_id.
{"labels":{"span_id":"405e4b409d62cd38","trace_id":"7893cdf3ce9d2401ffcee7d7f0db569d"},"value":"1.090101375","timestamp":1647142355.737}
For the exemplar pop-up dialog to show a link to Tempo, you do have to configure the Label name to be trace_id in the Prometheus data source configuration. The default is traceID. Otherwise, you will not see the link. You cannot edit the pre-configured Prometheus data source in your cloud account. You will have to create another Prometheus data source with the same connection information, then add the exemplar configuration.
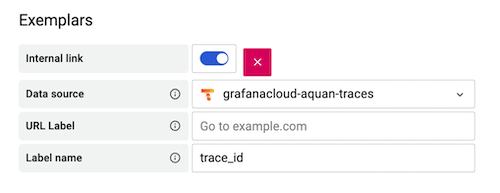
Also, since exemplars are still new, you do have to request it to be enabled for your Grafana Cloud account. If you run Grafana locally, the latest release of Grafana already supports exemplars.
Correlating logs, metrics, and traces in Grafana
Observability is not only just about collecting all the telemetry data in the form of logs, metrics, and traces. More importantly, it’s about the ability to correlate this telemetry data and derive actionable insights from it.
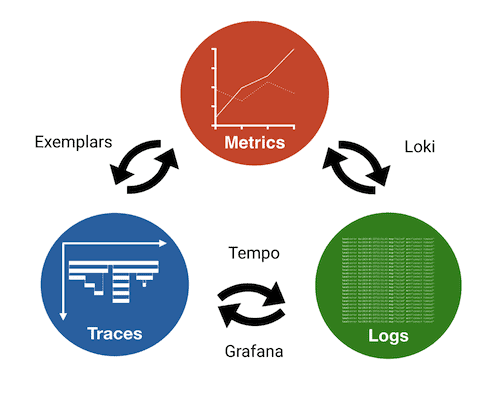
You can obviously connect and correlate any telemetry data visually by graphing them onto the same dashboard. Import the Hello Observability dashboard from the exported cloud/dashboards/hello-observability.json file and select the corresponding Loki and Prometheus data sources. You will see the same Hello Observability dashboard showing and connecting logs, metrics, and traces together.
On top of dashboards, Grafana enables you to connect and correlate logs, metrics, and traces in many different ways:
- Find relevant logs from your metrics using split screen. Loki’s logs are systematically labeled in the same way as your Prometheus metrics, using the same Service Discover mechanism. This enables you to find the logs for any given metrics visualization for faster troubleshooting from one UI with just a few clicks. For example, from the Requests per Minute panel, click on Explore then Split, and select the Loki data source. You will see relevant logs for the metrics in the same time range. The logs provide the exact context for the metrics we are visualizing and investigating.

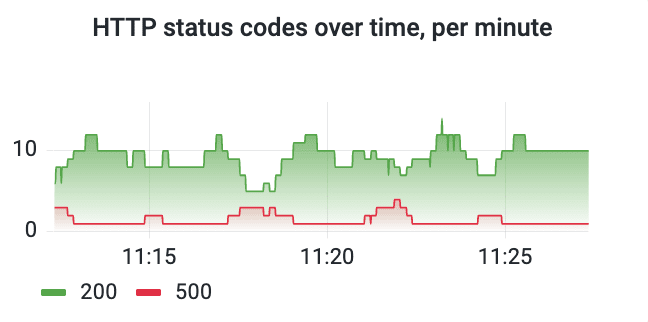
- Extract metrics from logs using Loki. Loki uses LogQL, a Prometheus-inspired query language to extract metrics from logs. Extracting metrics from logs and visualizing log messages in time series visualizations makes it easy and fast to get rich insight into the behavior of applications. As an example, the HTTP status codes over time panel is a metrics visualization created based on Tomcat access logs, using the following query:
sum by (status) (count_over_time( {job="tomcat-access"} | pattern<> – – <> “ <_>” != "/metrics" [1m]))
- Find traces using logs with trace ID. As you have seen, you can pivot from logs to traces easily following the trace ID link. Using logs, you can search by path, status code, latency, user, IP, or anything else you can add onto the same log line as a trace ID. For example, you can easily filter the logs down to see only the traces that failed, exceeded latency SLAs, etc. This makes it much easier to troubleshoot issues when they do occur.
- Find all the logs for a given span. Spans contain links to associated logs. You can explore relevant logs associated with spans with just one click.
- Find traces from metrics using exemplars. When traces, logs, and metrics are decorated with consistent metadata, you can create correlations that were not previously possible. As you have seen from the Latency panel, Prometheus metrics are decorated with trace ID when OpenTelemetry is also used for tracing. When you jump from an exemplar to a trace, you are now able to go directly to the logs of the struggling service!
Conclusion
Wow, that was a lot!
But hopefully, you saw how easy it is to instrument a Spring Boot application for logs, metrics, and traces, and how Grafana’s opinionated observability stack based on Prometheus, Grafana Loki, and Grafana Tempo can help you connect and correlate your telemetry data cohesively in Grafana Cloud. Instrument your applications and have fun dashboarding!
Grafana Cloud is the easiest way to get started with metrics, logs, traces, and dashboards. We have a generous free forever tier and plans for every use case. Sign up for free now!
Guest post originally published on the Grafana Labs blog by Adam Quan
Source CNCF
For enquiries, product placements, sponsorships, and collaborations, connect with us at [email protected]. We'd love to hear from you!
Our humans need coffee too! Your support is highly appreciated, thank you!
