Running containerized apps on Google Kubernetes Engine (GKE) is a way for a DevOps team to focus on developing apps, rather than on the operational tasks required to run a secure, scalable and highly available Kubernetes cluster. Cloud Logging and Cloud Monitoring are two of several services integrated into GKE that provide DevOps teams with better observability into applications and systems, for easier troubleshooting in the event of a problem.
Using Cloud Logging
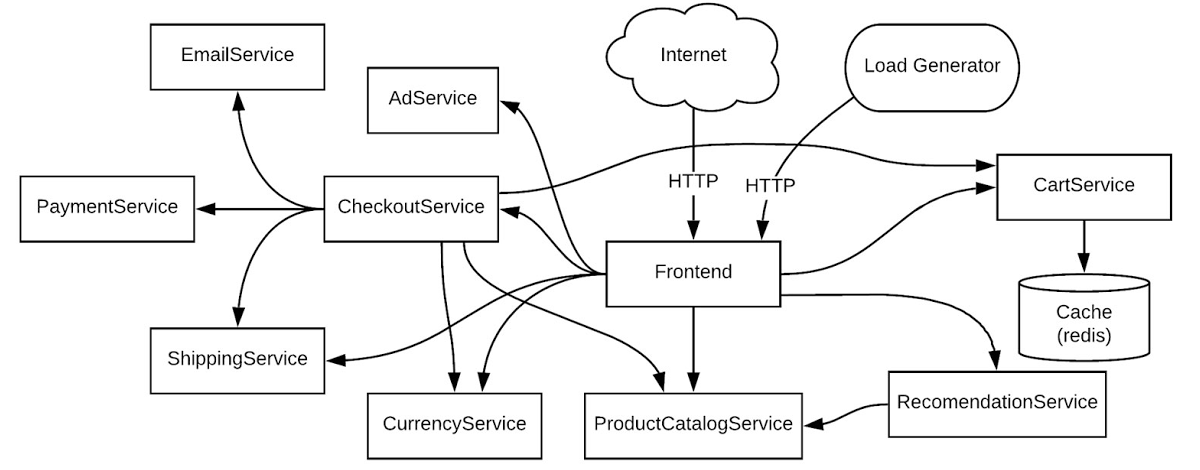
Let’s look at a simple, yet common use case. As a member of the DevOps team, you have received an alert from Cloud Monitoring about an application error in your production Kubernetes cluster. You need to diagnose this error. To use a concrete example, we will work through a scenario based on a sample microservices demo app deployed to a GKE cluster. In this demo app, there are many microservices and dependencies among them.
From our partners:
For this example, consider the demo app running in your staging environment shared by multiple teams or a production environment running multiple workloads. Let’s see how you can work through troubleshooting a simple error scenario.
Let’s start this example from an alert triggered by a large number of HTTP 500 errors. You can create a logs-based metric based on the number of log events or the content of the log entries which you can also use for alerting purposes. Cloud Monitoring provides Alerting which can be set-up to send emails, SMS or generate notifications in third-party apps.
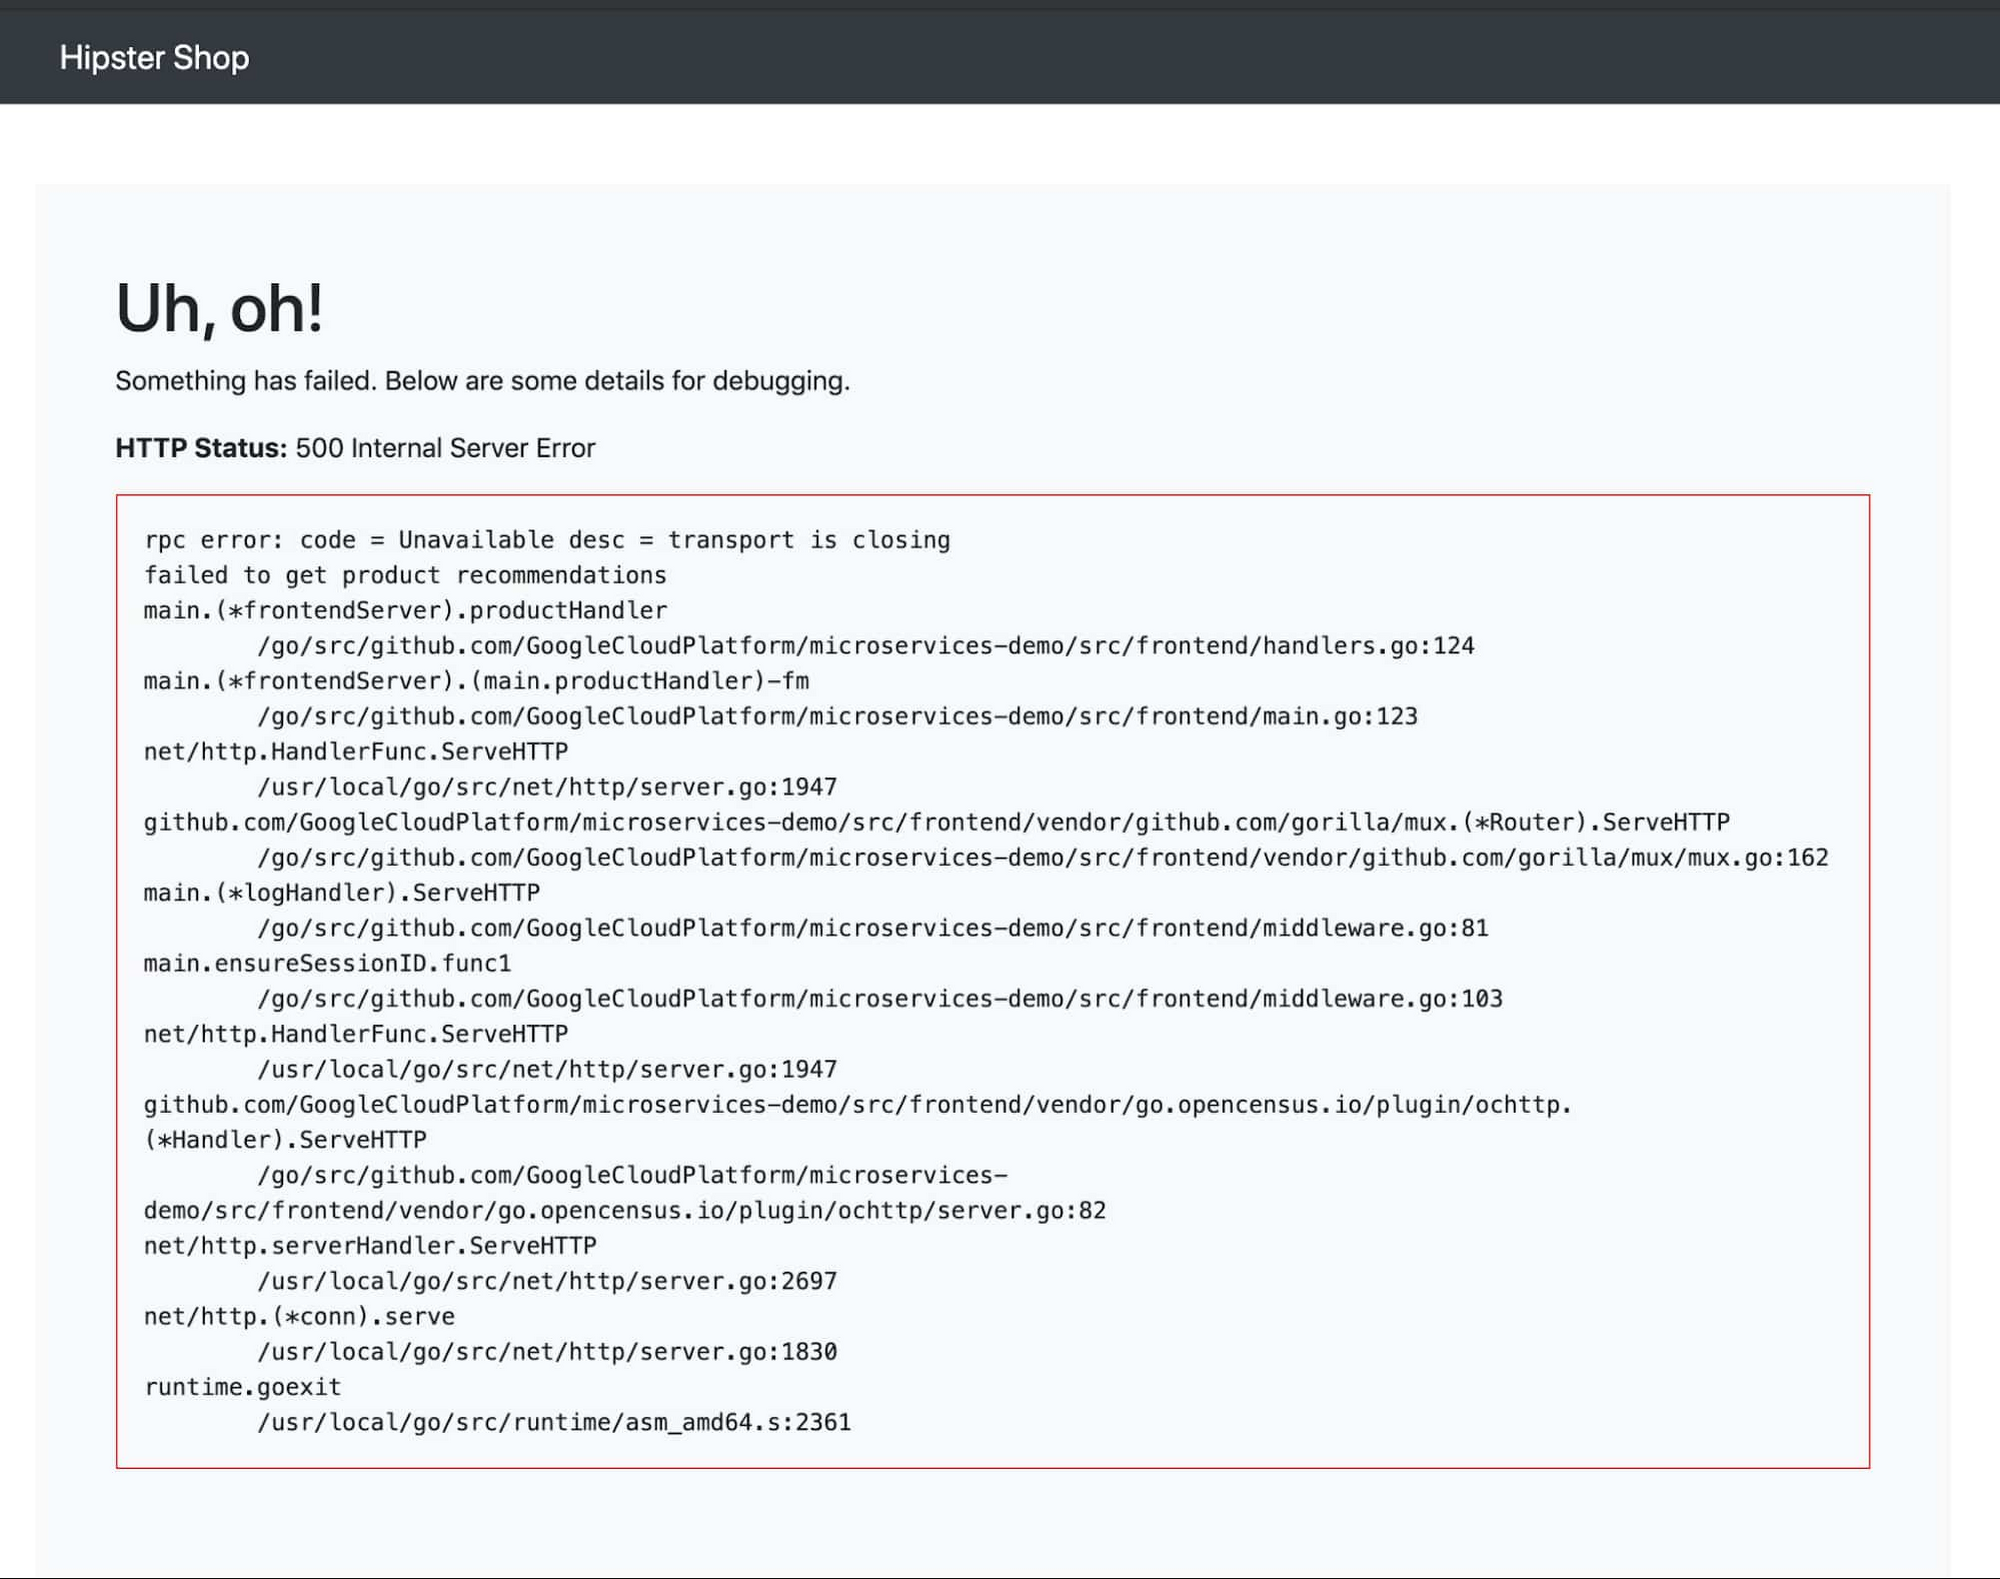
In our example, let’s say there are HTTP 500 errors with the following stack trace.
If you have already created the alerting policy in Cloud Monitoring, you will receive notifications like the following one:
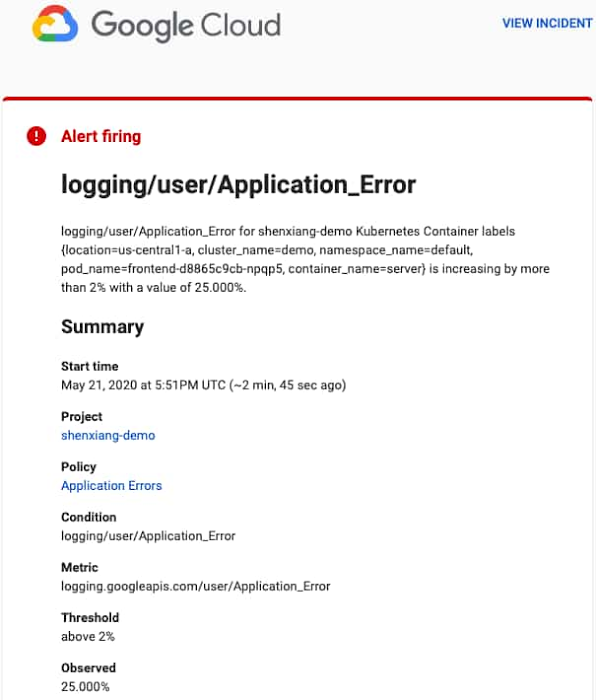
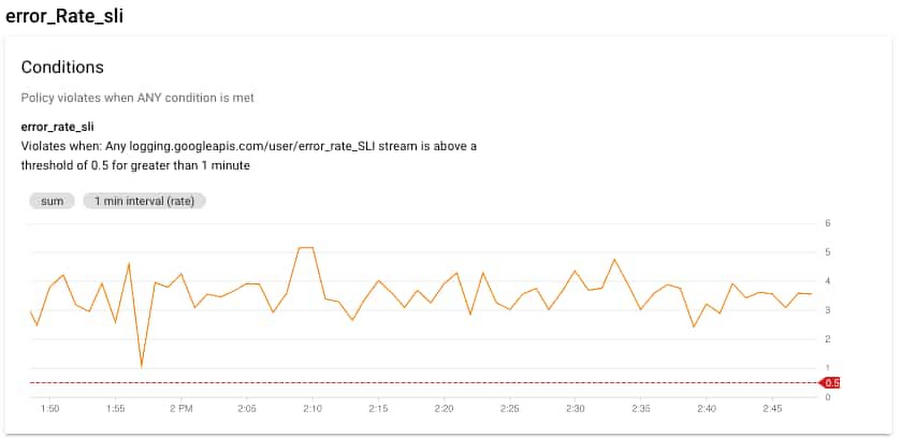
You can view the incident details by clicking the ‘VIEW INCIDENT’ link. Following the Policy link from the alert notification opens the alerting section of the Monitoring UI.
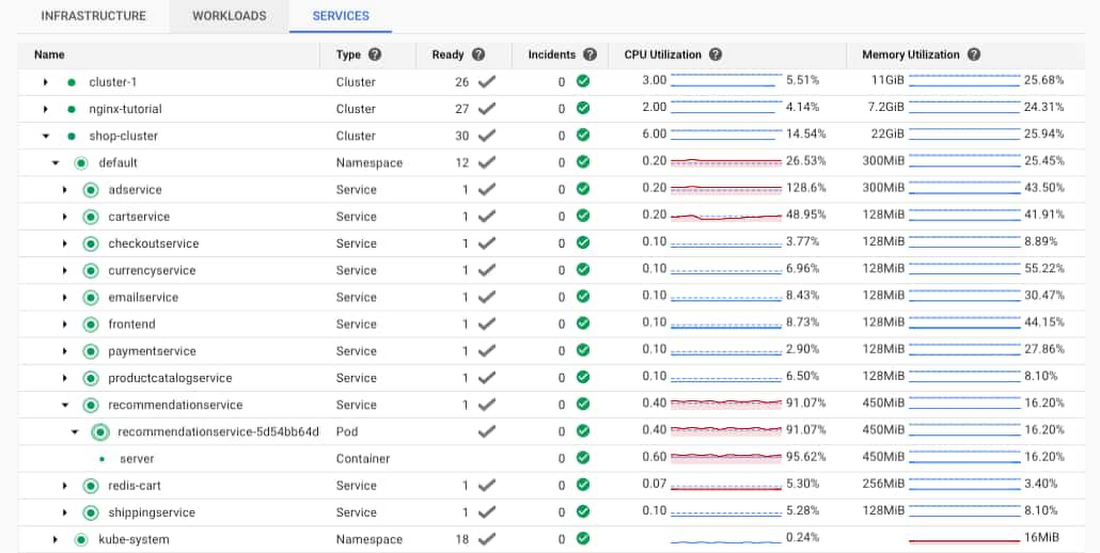
One of the first places that you can look for information on the errors is the Kubernetes Engine section of the Monitoring console. Using the workload view, you can select your cluster and easily see the usage resources for the pods and containers running in the cluster. In this case, you can see that the pod and container for the recommendationservice have very high CPU utilization. This could mean that the recommendationservice is overloaded and not able to respond to requests from the frontend. Ideally, you also have an alert set up for the CPU and memory utilization for the container, which would also generate alerts.
Opening the link to the server container under the recommendationservice service/pod displays the details about the container. The details include metrics like memory and CPU, logs and details about the container. You can also click the MANAGE link to navigate directly to the pod details in the GKE console.
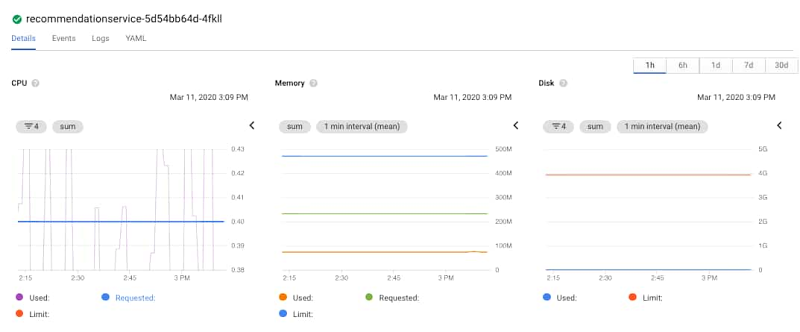
Because Monitoring is integrated into the GKE console, you can view monitoring graphs for the pod. Using the CPU graph, you can see that the CPU is regularly exceeding the requested amount of CPU. Notice the purple line crossing the solid blue line in the lower left graph. You can also easily see that the memory and disk space are not highly utilized, eliminating them from a list of possible issues. In this case, the CPU could be the issue.
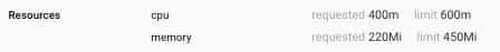
Clicking on the container, you can see the requested CPU, memory, and the deployment details.
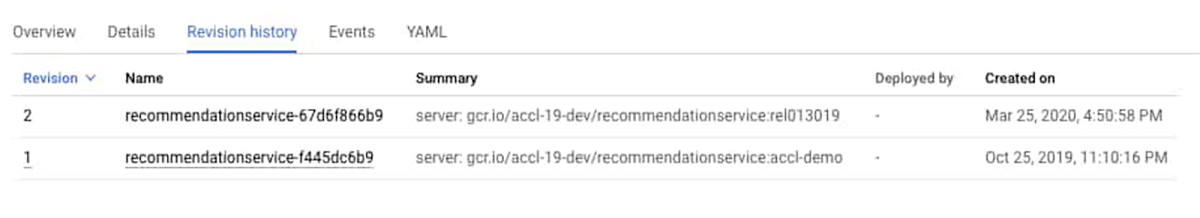
You can also click on the Revision history link to review the history of the container. You can see that there was a recent deployment.
It’s worth looking at the logs to see if there is any information about why additional CPU power is suddenly in demand. Since the original error was a 500 error served through the frontend pod, you can navigate to the frontend entry under Workloads. To view the frontend logs, click on the Container logs link. This opens the Cloud Logging UI with a specific pre-constructed filter for the logs of this container.
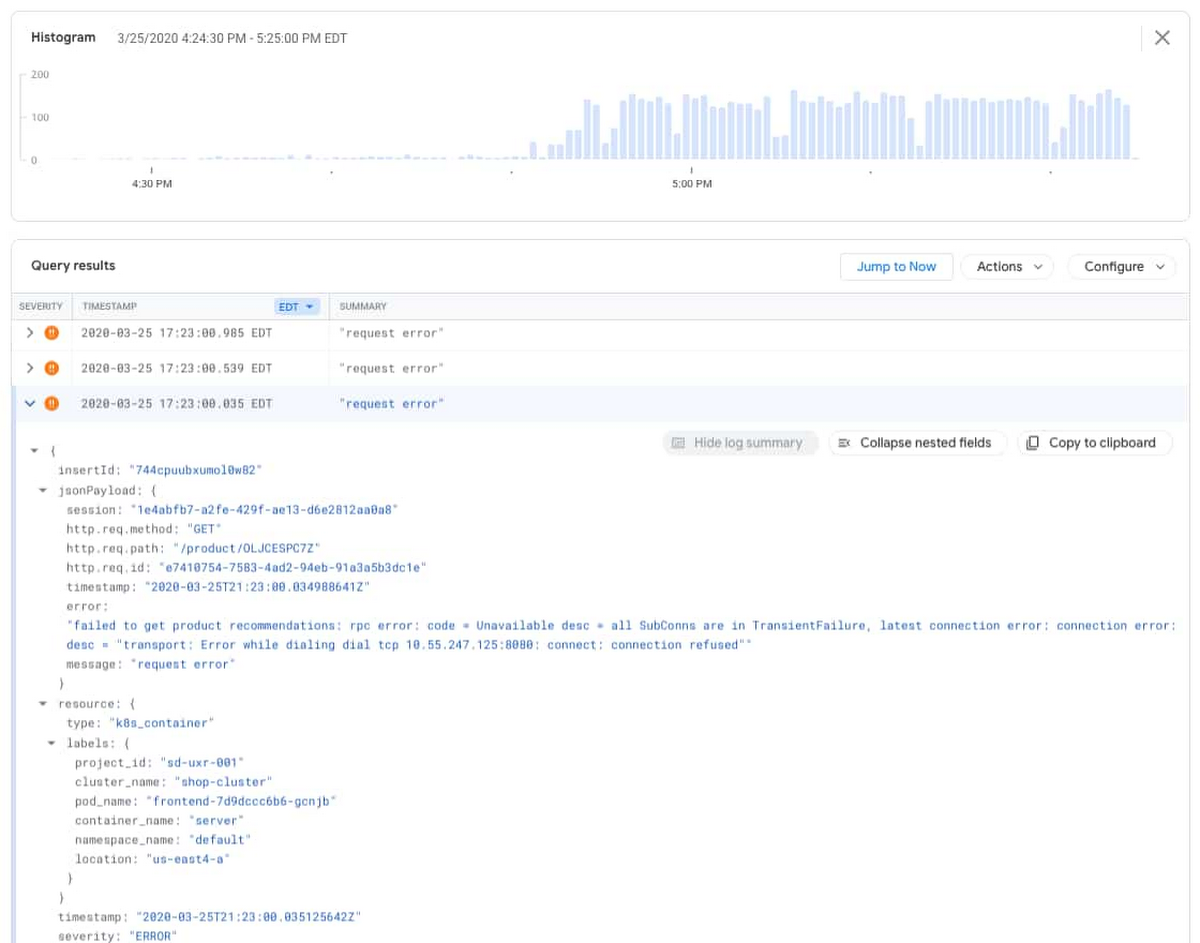
In the Logs Viewer, you can see the detailed query, a histogram of the logs, and the individual log entries. The histogram feature provides context for how often log entries are observed over the given time window and can be a powerful tool to help identify application issues. In this case, you can see that the error entries started increasing at around 4:50PM.
By expanding the error entries, you can see the log message below.
“failed to get product recommendations: rpc error: code = Unavailable desc = all SubConns are in TransientFailure, latest connection error: connection error: desc = "transport: Error while dialing dial tcp 10.55.247.125:8080: connect: connection refused"
This matches the original HTTP 500 error served through the frontend pod. Now, take a look at the recommendationservice pod logs by adjusting the logging filter to surface error entries with the recommendations name. The filter below restricts the entries to errors from the containers in the pod with a prefix of “recommendations”.
resource.type="k8s_container"resource.labels.project_id="YOUR_PROJECT"resource.labels.location="us-east4-a"resource.labels.cluster_name="shop-cluster"resource.labels.namespace_name="default"resource.labels.pod_name:"recommendations"severity=ERROR
Now, adjust the filter to look at the non-error log entries.
resource.type="k8s_container"resource.labels.project_id="YOUR_PROJECT"resource.labels.location="us-east4-a"resource.labels.cluster_name="shop-cluster"resource.labels.namespace_name="default"resource.labels.pod_name:"recommendations"severity=!ERROR
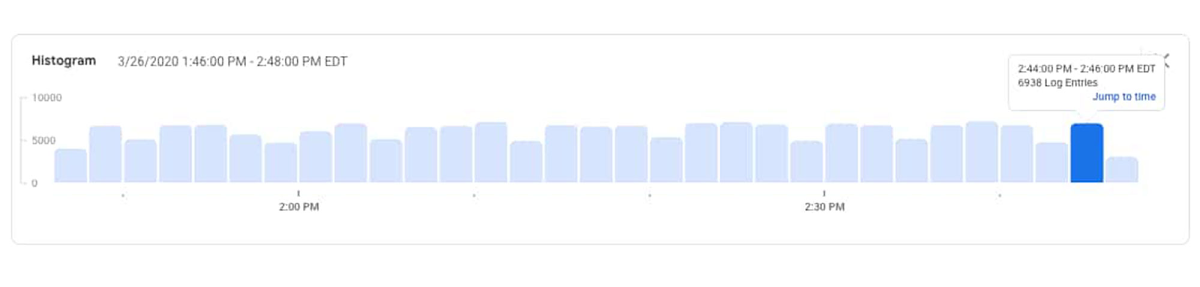
You can see in the logs histogram that there are log entries being generated from the service, which likely means that the service is still receiving and responding to some requests.
Since no errors were generated by the recommendationservice in the logs, this helps to confirm the suspicion that there is an issue with the latest code deployment causing it to use more CPU than before. With this information, you can take action. You could either increase the CPU request in the container YAML or roll back the recent update to the recommendationservice and contact the developer responsible for the service to review the increase in CPU utilization. The specific action depends on your understanding of the code and recent deployments, your organization and policies. Whichever option you take, you can continue monitoring your cluster for adverse events using Cloud Logging and Monitoring.
Learn more about Cloud Logging, Monitoring and GKE
We built our logging and monitoring capabilities for GKE into Cloud Operations to make it easy for you to monitor, alert and analyze your apps. If you haven’t already, get started with Cloud Logging on GKE and join the discussion on our mailing list. As always, we welcome your feedback.
For enquiries, product placements, sponsorships, and collaborations, connect with us at [email protected]. We'd love to hear from you!
Our humans need coffee too! Your support is highly appreciated, thank you!