Easy Telemetry Instrumentation on GKE with the OpenTelemetry Operator
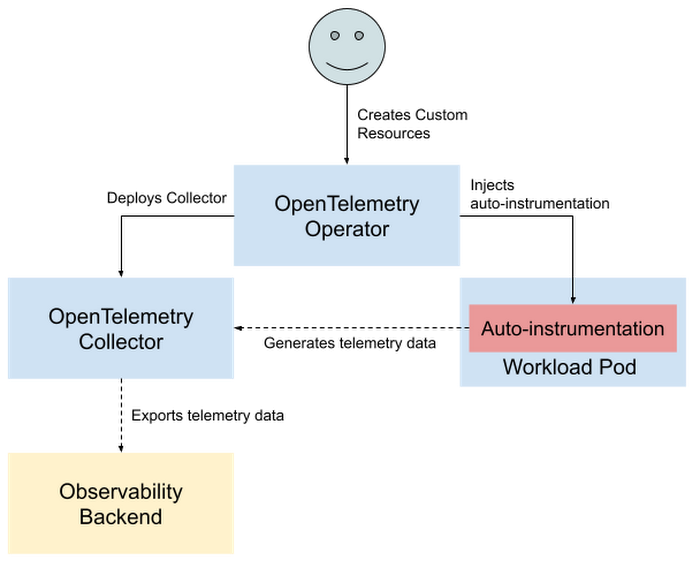
The OpenTelemetry Operator is designed to provide auto-instrumentation to export traces and metrics in new and existing applications without any code changes. It also automates the deployment of OpenTelemetry Collectors, which offer vendor-agnostic monitoring pipelines. These two features help simplify both the onboarding process for new users and the day-to-day operational burden of monitoring fully-instrumented applications.
From our partners:
Across this spectrum of use cases, we’ve identified a few common problems that can be easily solved using the OpenTelemetry Operator. We gathered these under a single GitHub repository (https://github.com/GoogleCloudPlatform/opentelemetry-operator-sample) with the goal of providing a set of samples and walkthroughs for installing and working with the Operator. In this post, we’ll talk about some benefits of the OpenTelemetry Operator and how to use it.
Getting started with the OpenTelemetry Operator
The two main functions of the Operator are managing OpenTelemetry Collectors and auto-instrumenting applications. You can configure these Collectors and instrumentation through Custom Resources (explained in more detail later in this post).
kubectl command such as:kubectl apply -f https://github.com/open-telemetry/opentelemetry-operator/releases/download/v0.60.0/opentelemetry-operator.yaml
opentelemetry-operator-system namespace, eagerly waiting to serve your telemetry needs. But for it to actually do something, we need to have it set up a Collector.
Deploying and configuring the Collector
The first main feature of the Operator is that it can install, manage, and configure instances of the OpenTelemetry Collector. For background, the Collector works with numerous plugins to process and export telemetry data. That data can be ingested from a variety of sources with receivers, modified in-transit with processors, and reported to several popular telemetry backend services with exporters. Essentially, it provides a routing solution for flexible, vendor-agnostic, and instrumentation-independent observability.
Setting up the Collector with the Operator is done by creating an OpenTelemetryCollector object. This is a namespaced Custom Resource, so it is created in the same Namespace you want the Collector to run in, for example:
apiVersion: opentelemetry.io/v1alpha1
kind: OpenTelemetryCollector
metadata:
  name: collector
  namespace: otel-collector
spec:
  config: |
    receivers:
      otlp:
        protocols:
          grpc:
          http:
    processors:

    exporters:
      logging:

    service:
      pipelines:
        traces:
          receivers: [otlp]
          processors: []
          exporters: [logging]
OpenTelemetryCollector object has numerous settings to control how the Collector is deployed. For example, it can be deployed as a sidecar container by setting mode: sidecar like so:apiVersion: opentelemetry.io/v1alpha1
kind: OpenTelemetryCollector
metadata:
name: collector-sidecar
spec:
mode: sidecar
...
sidecar.opentelemetry.io/inject: “true”. It’s a common pattern to run sidecar Collectors with resource detection, each forwarding telemetry to a load-balanced Collector service that exports the data. In that setup, the sidecar Collector can detect accurate resource information for the Pod while the service Collector can handle processing and exporting in one place.Using the OpenTelemetryCollector object also provides an easy way to set a specific container image to use for the Collector. This is really useful for working with custom Collectors, such as those built with the Collector builder tool (see our sample repository for working with the Collector builder at https://github.com/GoogleCloudPlatform/opentelemetry-collector-builder-sample). Custom-built Collectors allow you to completely control the build and deployment pipeline for your Collector, offering the ability to strip down a Collector to only the components you need. The resulting image saves space and reduces the dependency surface area for security risks.
For example, run a custom Collector image with the following config change:
apiVersion: opentelemetry.io/v1alpha1
kind: OpenTelemetryCollector
metadata:
  name: custom-collector
spec:
  image: gcr.io/my-project/otel-builds/collector:latest
...
Adding auto-instrumentation to Pods and Deployments
The second main feature of the Operator is that it provides easy auto-instrumentation for telemetry. Because even with a Collector ready to ingest and route your telemetry, you still need to instrument your applications to report some data. In general, instrumentation can be done either manually or automatically. While manual instrumentation involves the process of modifying application code to use OpenTelemetry SDKs, automatic instrumentation uses OpenTelemetry agents to inject instrumentation into your program at runtime.
Obviously, the option of auto-instrumenting your applications comes with less engineering investment than manual instrumentation. This makes it great for rapidly onboarding to OpenTelemetry, and is currently available for applications written in Java, NodeJS, Python, and .NET. It is even possible to combine auto-instrumentation across languages, making it useful for a system design with multi-language microservices.
The OpenTelemetry Operator provides this auto-instrumentation through mutating webhooks that inject a sidecar container into the application Pod’s specification. This sidecar container provides instrumentation agent code and shares a filesystem with the Pod’s main container so that it can inject traces into the application. Most importantly, it does all of this without the need to write any code.
To get started with auto-instrumentation, first create an Instrumentation object to define your desired instrumentation settings (such as sample rate):
apiVersion: opentelemetry.io/v1alpha1
kind: Instrumentation
metadata:
  name: my-instrumentation
spec:
  exporter:
    endpoint: http://otel-collector:4317
  propagators:
    - tracecontext
    - baggage
    - b3
  sampler:
    type: parentbased_traceidratio
    argument: "0.25"
OpenTelemetryCollector objects, Instrumentation is also a namespaced Custom Resource. Namespacing in this case gives you finer control over the auto-instrumentation settings that are passed on to different parts of your application (though Pods can reference Instrumentations across Namespaces too).The Operator will map these settings to an annotation on corresponding application Pods. This annotation takes the form of instrumentation.opentelemetry.io/inject-<LANGUAGE> and it’s how you opt-in a Pod for auto-instrumentation. For example, to auto-instrument a Pod running a Java application, add the following annotation to the Pod’s metadata:
instrumentation.opentelemetry.io/inject-java: "my-instrumentation" |
my-instrumentation value refers to the name of the Instrumentation object created earlier. This can also be set to an Instrumentation object from a different namespace, or true to pick a default Instrumentation from the current namespace, or false to explicitly opt the Pod out from auto-instrumentation. These options offer the flexibility to mix and match different instrumentation configurations in a system by referring to different configurations on different services. The full list of available annotations is documented on the Operator’s GitHub.Once a Pod is annotated, the Operator will automatically pick up the change and update the Pod spec to include the auto-instrumentation sidecar container. The same type of annotation can be used for Pods within a Deployment (or any kind of replica controller, such as a CronJob or ReplicaSet). Simply set the annotation on the Pod template metadata defined in the Deployment. For example, instrument a Python application by adding the annotation to its Deployment as shown in bold below:apiVersion: apps/v1
kind: Deployment
metadata:
name: python-deployment
labels:
app: py-app
spec:
replicas: 3
selector:
matchLabels:
app: py-app
template:
metadata:
labels:
app: py-app
annotations:
instrumentation.opentelemetry.io/inject-python: "true"
spec:
containers:
- name: app
image: my-python-app:latest
kubectl annotate namespace my-node-app instrumentation.opentelemetry.io/inject-nodejs="true" |
Our solutions repository for GKE users
The Operator makes it much easier to set up OpenTelemetry collection and auto-instrumentation than the alternative, manual process. However, we recognize that there are still a few steps that could be simplified and common setups to document, especially for new users who are just interested in trying it out for a quick demo. To help with this, we launched a new GitHub repository at https://github.com/GoogleCloudPlatform/opentelemetry-operator-sample focused on improving ease-of-use with the Operator.
Sample Apps
The repository includes ready-to-use configs, simplified commands for deploying and working with the Operator, and even a few sample apps written in various languages. These samples provide an end-to-end demonstration of setting up the Operator, configuring the Collector, and adding auto-instrumentation for a variety of use cases.
One of these samples is a basic client-server NodeJS app meant to showcase auto-instrumentation without any code modifications. Build this app yourself and run it alongside the Operator to play with auto-instrumentation and get a hands-on understanding of how it works before adding it to your existing workloads:
make build
make deploy
kubectl apply -f k8s/.
Config Recipes
To demonstrate different use cases of the Operator, we’ve curated a set of recipes covering various Operator configurations. Each recipe works with the sample apps to enrich those demos, but they are also production-ready so there’s no difference between the steps to experiment and deploy them.
For example, the Cloud Trace integration recipe updates a Collector configuration to enable reporting to the GCP tracing backend. This is the same configuration you would use for a production application, and if you already have a Collector set up with the Operator it can be turned on with one command:
kubectl apply -f collector-config.yaml |
Over time, we plan to grow this repository with more configurations for different use cases. These off-the-shelf recipes are tailored for usability on GKE and preconfigured to work optimally with other GCP products like Cloud Build and Cloud Trace.
We want this repository to provide a source for both onboarding with OpenTelemetry and putting the Operator to use in production environments. This repository is open-source and accepting contributions, so if you have a request or problem to report feel free to reach out on GitHub.
By: Mike Dame (Software Engineer)
Source: Google Cloud Blog
For enquiries, product placements, sponsorships, and collaborations, connect with us at [email protected]. We'd love to hear from you!
Our humans need coffee too! Your support is highly appreciated, thank you!