Android renders user interface (UI) by generating a frame from your app and displaying it on the screen. To ensure that a user’s interaction with your app is smooth, your app should render each frame under the refresh rate that is determined by each device–for example, Pixel 6 allows rendering 90 frames per second at the maximum, which means that each frame needs to be rendered under 11ms. If your app suffers from slow UI rendering, the Android framework is forced to skip frames. When this happens, the user perceives unexpected and distracting visual glitches, also known as jank.
There are several sources of jank such as janks caused by applications or janks caused by SurfaceFlinger. This article focuses on jank caused by applications, and the tools Android Studio offers to spot and fix them, by inspecting a live app and opening recorded traces to solve performance problems in your app.
From our partners:
Note: This article shows the updated jank detection UI starting from Android Studio Chipmunk, when used with physical devices or Android emulators running Android 12 (API level 31) or higher.
Recording a trace from live interactions
The following example uses the JankStatsSample application in the GitHub performance samples repository to showcase how to spot the cause of the jank using CPU profiler.
performance-samples/JankStatsSample at main · android/performance-samples
This sample project shows how to use the JankStats library. It includes multiple simple sample activities…
github.com
- Open the
JankStatsSampleand run the application
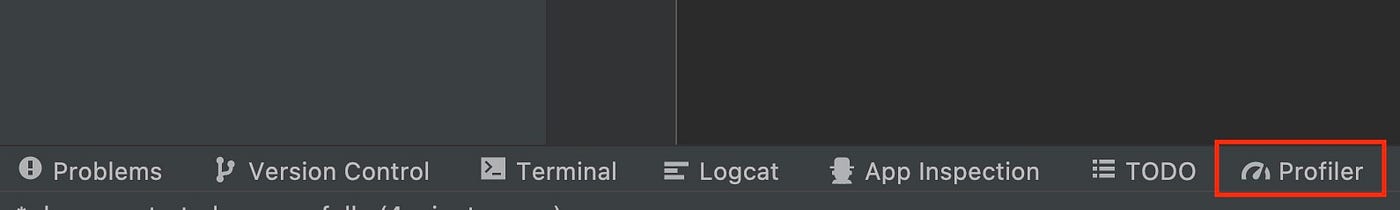
2. Open the Profiler tab at the bottom of the Android Studio
3. Start a new profiling session by clicking the + icon in the left pane of the Profiler, then select the device name and the application process, against which you want to run the profiler.
Note: Although it’s possible to profile debuggable apps, it’s recommended to profile profileable apps because profiling debuggable apps adds significant performance cost as a side effect. See the documentation about Profileable applications for more details.
4. Click the CPU row
5. Select System Trace Recording and click Record
6. Interact with the application to gather some data then click the Stop button.
Then Android Studio will show Display section with the janky frames visible
or by checking the All Frames checkbox, you can toggle if the trace shows the non-janky frames as well.
You can see the detailed frame information by hovering the mouse tip on each frame or by clicking it. There are three types of frames if you check the All Frames checkbox.
- Green frame
A normal frame that isn’t considered as a jank
- Red frame
A frame that was considered as a jank because the app process ran longer than expected and it missed the deadline of the expected duration of the frame. From the app developer’s point of view, actionable frames are usually red frames.
- Yellow frame
A frame that was considered as buffer stuffing, which means the app keeps sending the frames to the system before the previous frame is presented. This is usually caused by the previous frame being janky and there isn’t much app developers can do about the yellow frames.
By checking the Lifecycle checkbox, you can toggle showing/hiding four additional tracks.
These four tracks:
ApplicationWait for GPUCompositionFrames on display
have been available since Android Studio Bumblebee. You can see the detailed explanation of each track in the documentation.
Inspecting janky frames
Now, let’s see how you can diagnose what causes the janky frames in your app.
- Select a janky frame in the
Janky framestrack, then the corresponding lifecycle data is highlighted in theDisplaysection and the corresponding thread data is highlighted in theThreadssection.
The dashed Deadline represents the deadline. When a frame’s duration exceeds that deadline, the frame is considered as janky.
You can also see the detailed analysis at the right pane of Android Studio.
2. If you look at the corresponding trace section in the main thread of the application, you can see a large amount of time is spent in `View#draw`.
Also, you can see the large amount of thread state is sleeping if you look at the main thread state in the detailed analysis pane.

3. Let’s look at the code where View#draw is called.
You can spot the View#onDraw is overridden in the JankyView class.
override fun onDraw(canvas: Canvas) {
  simulateJank()
  super.onDraw(canvas)
}
The simulateJank method that is called from onDraw is defined as follows,
fun simulateJank(
    jankProbability: Double = 0.3,
    extremeJankProbability: Double = 0.02
) {
    val probability = nextFloat()

    if (probability > 1 - jankProbability) {
        val delay = if (probability > 1 - extremeJankProbability) {
            nextLong(500, 700)
        } else {
            nextLong(32, 82)
        }

        try {
            // Make jank easier to spot in the profiler through tracing.
            trace("Jank Simulation") {
                Thread.sleep(delay)
            }
        } catch (e: Exception) {
        }
    }
}
Then you can spot Thread.sleep is called inside the simulateJank method. It may be obvious because the JankStatsSample application is created to simulate janks on purpose, but the important thing is that you are able to spot the actual code by looking from the overview of the janky frames to more detailed analysis.
Note: Although it’s obvious that calling <em class="lh">Thread.sleep</em> is problematic in this example, in reality you will need to make more difficult decisions when optimizing your real application code. The Microbenchmark library can help you measure if the changes that you’re making are having the desired effect.
Note: The system tracing shows various sections captured by platform code and libraries that are part of your app. Oftentimes it won’t have enough information. To improve that, add custom trace, one of the ways of adding custom trace is by using the <em class="lh">trace(“MySection”) { /* this will be in the trace */ }</em> in the AndroidX Tracing library.
For example, <em class="lh">trace(“Jank Simulation”) { … }</em> in this example is shown in the corresponding thread’s trace section.
For more information about reading traces and adding custom ones, visit Overview of system tracing.
4. Let’s change the code to not call the simulateJank method in onDraw, then see if the janky frames are still observed.
override fun onDraw(canvas: Canvas) {
  // simulateJank()
  super.onDraw(canvas)
}
This time, when you rerun the system trace recording, you will see no janky frames after interacting with the application!
Loading a saved trace
Alternatively, you can also save the trace and load it later by following steps below. Saving and loading the trace is useful in that you can compare the different versions of traces, share it with other people.
Note: You can also obtain the system traces by using the Macrobenchmark library.
- Follow the same steps from 1 to 6 as for recording a trace from live interactions.
- Export the recording by clicking the save icon
3. Then later, load the saved system trace recording by navigating to + -> Load from file… and select the saved file exported in the previous step
4. Select the process you want to analyze. After the process list dropdown is shown, you can start typing the part of the process name to quickly locate it.
Then you can load the saved trace and see the janky frames same as recording from the live interactions.
Summary
That’s it! Starting with Android Studio Chipmunk, you are able to see more precise profiling data that helps you to spot your application’s janks.
To learn more about the usage of CPU profiler, make sure to check out the documentation and help us improve our tools by navigating to `Help -> Submit Feedback` in Android Studio.
You can also check out the What’s new in app performance talk at Google I/O that covers a broad range of performance topics including avoiding janky frames.
And if you want to check out our new library for detecting and reporting jank in your production apps running on user’s devices, head on to documentation for JankStats!
By Takeshi Hagikura
Source Android
For enquiries, product placements, sponsorships, and collaborations, connect with us at [email protected]. We'd love to hear from you!
Our humans need coffee too! Your support is highly appreciated, thank you!